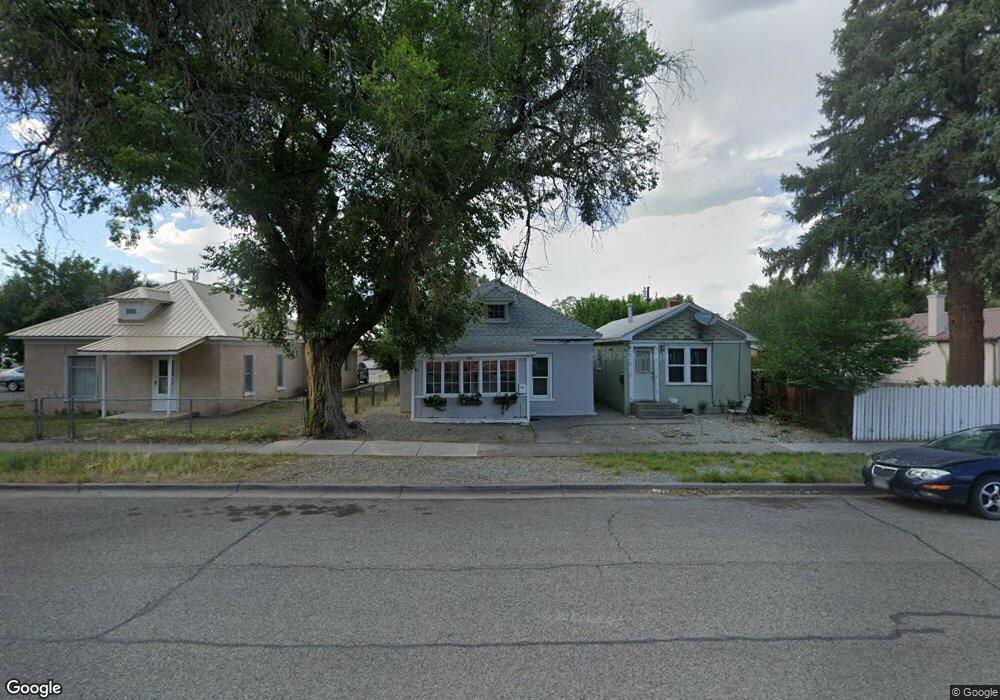
521 9th St Alamosa, CO 81101
Estimated Value: $186,000 - $226,225
2
Beds
11
Baths
1,019
Sq Ft
$200/Sq Ft
Est. Value
About This Home
This home is located at 521 9th St, Alamosa, CO 81101 and is currently estimated at $203,806, approximately $200 per square foot. 521 9th St is a home located in Alamosa County with nearby schools including Alamosa Elementary School, Ortega Middle School, and Alamosa High School.
Ownership History
Date
Name
Owned For
Owner Type
Purchase Details
Closed on
Sep 18, 2017
Sold by
Hertrick Christopher J and Hertrick Melissa A
Bought by
Waneka Leslie Glenn
Current Estimated Value
Purchase Details
Closed on
Oct 3, 2003
Sold by
Dee Harris Donald Richard and Dee Angel
Bought by
Hertrich Christopher J and Hertrich Melissa A
Purchase Details
Closed on
May 23, 1996
Sold by
San Juan Management Llc
Bought by
Dee Harris Donald Richard and Dee Angel
Purchase Details
Closed on
Mar 21, 1996
Sold by
Johnson Melvin P and Johnson Anita M
Bought by
San Juan Management Llc
Purchase Details
Closed on
Mar 13, 1992
Sold by
Moreland Terry
Bought by
Johnson Melvin
Purchase Details
Closed on
May 4, 1990
Sold by
Mccallister Kenneth
Bought by
Moreland Terry
Purchase Details
Closed on
Jun 26, 1989
Sold by
Towsley Oren L
Bought by
Mccallister Kenneth
Purchase Details
Closed on
Jan 1, 1964
Bought by
Towsley Oren
Create a Home Valuation Report for This Property
The Home Valuation Report is an in-depth analysis detailing your home's value as well as a comparison with similar homes in the area
Home Values in the Area
Average Home Value in this Area
Purchase History
| Date | Buyer | Sale Price | Title Company |
|---|---|---|---|
| Waneka Leslie Glenn | $88,900 | None Available | |
| Hertrich Christopher J | $72,900 | -- | |
| Dee Harris Donald Richard | $55,000 | -- | |
| San Juan Management Llc | -- | -- | |
| Johnson Melvin | $28,700 | -- | |
| Moreland Terry | $25,000 | -- | |
| Mccallister Kenneth | -- | -- | |
| Towsley Oren | -- | -- |
Source: Public Records
Tax History Compared to Growth
Tax History
| Year | Tax Paid | Tax Assessment Tax Assessment Total Assessment is a certain percentage of the fair market value that is determined by local assessors to be the total taxable value of land and additions on the property. | Land | Improvement |
|---|---|---|---|---|
| 2024 | $646 | $12,417 | $1,005 | $11,412 |
| 2023 | $662 | $12,538 | $1,015 | $11,523 |
| 2022 | $651 | $8,468 | $697 | $7,771 |
| 2021 | $670 | $8,468 | $697 | $7,771 |
| 2020 | $569 | $8,468 | $697 | $7,771 |
| 2019 | $571 | $7,076 | $697 | $6,379 |
| 2018 | $538 | $6,542 | $702 | $5,840 |
| 2017 | $538 | $6,542 | $702 | $5,840 |
| 2016 | $698 | $8,524 | $776 | $7,748 |
| 2015 | $698 | $8,524 | $776 | $7,748 |
| 2014 | -- | $8,524 | $776 | $7,748 |
| 2013 | -- | $8,524 | $776 | $7,748 |
Source: Public Records
Map
Nearby Homes
- 1002 Edison Ave
- 1121 San Juan Ave
- 814 10th St
- 1201 San Juan Ave
- 1623-B 6th St
- 400 & 406 6th St
- 1306 State Ave
- 807 13th St
- 0 U S 160
- Lot 14 Fourth St
- 531 Alamosa Ave
- 631 2nd St
- 302 Bell Ave
- 61 Conejos Ave
- 12 Rio Grande Ave
- 735 First St
- 0 Mountain View Blvd Unit 23881373
- 1704 Ross Ave
- 1731 San Juan Ave
- 1330 W 7th St