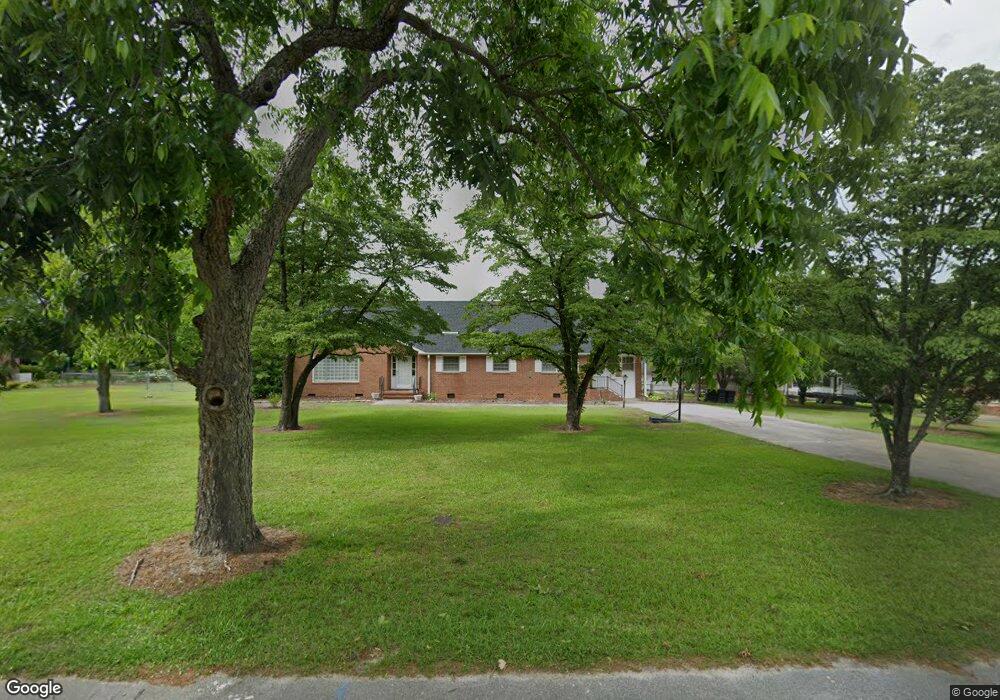
521 E 2nd Ave Red Springs, NC 28377
Estimated Value: $226,000 - $263,000
3
Beds
3
Baths
2,797
Sq Ft
$86/Sq Ft
Est. Value
About This Home
This home is located at 521 E 2nd Ave, Red Springs, NC 28377 and is currently estimated at $241,519, approximately $86 per square foot. 521 E 2nd Ave is a home located in Robeson County with nearby schools including Peterson Elementary School, Parkton Elementary School, and Red Springs Middle School.
Ownership History
Date
Name
Owned For
Owner Type
Purchase Details
Closed on
Jul 13, 2012
Sold by
Cottrell Garland and Cottrell Garland E
Bought by
Cottrell Garland
Current Estimated Value
Home Financials for this Owner
Home Financials are based on the most recent Mortgage that was taken out on this home.
Original Mortgage
$72,853
Outstanding Balance
$10,919
Interest Rate
3.25%
Mortgage Type
FHA
Estimated Equity
$230,600
Purchase Details
Closed on
Mar 24, 2011
Sold by
Currie Lisa C and Currie Michael Douglas
Bought by
Cottrell Garland E
Create a Home Valuation Report for This Property
The Home Valuation Report is an in-depth analysis detailing your home's value as well as a comparison with similar homes in the area
Home Values in the Area
Average Home Value in this Area
Purchase History
| Date | Buyer | Sale Price | Title Company |
|---|---|---|---|
| Cottrell Garland | -- | None Available | |
| Cottrell Garland E | $69,000 | -- | |
| Currie Lisa A | -- | -- |
Source: Public Records
Mortgage History
| Date | Status | Borrower | Loan Amount |
|---|---|---|---|
| Open | Cottrell Garland | $72,853 |
Source: Public Records
Tax History
| Year | Tax Paid | Tax Assessment Tax Assessment Total Assessment is a certain percentage of the fair market value that is determined by local assessors to be the total taxable value of land and additions on the property. | Land | Improvement |
|---|---|---|---|---|
| 2025 | $2,807 | $196,200 | $8,800 | $187,400 |
| 2024 | $2,802 | $196,200 | $8,800 | $187,400 |
| 2023 | $2,128 | $148,700 | $8,000 | $140,700 |
| 2022 | $2,094 | $146,200 | $8,000 | $138,200 |
| 2021 | $2,094 | $146,200 | $8,000 | $138,200 |
| 2020 | $2,079 | $146,200 | $8,000 | $138,200 |
| 2018 | $2,121 | $137,500 | $10,000 | $127,500 |
| 2017 | $1,999 | $137,500 | $10,000 | $127,500 |
| 2016 | $1,999 | $137,500 | $10,000 | $127,500 |
| 2015 | $1,999 | $137,500 | $10,000 | $127,500 |
| 2014 | $1,999 | $137,500 | $10,000 | $127,500 |
Source: Public Records
Map
Nearby Homes
- 613 E 3rd Ave
- 615 E 3rd Ave
- 205 N College St
- 0 Hwy 211 Unit 742487
- Lot 18 Daniel McLeod Rd
- Lot 2 Daniel McLeod Rd
- Lot 17 Daniel McLeod Rd
- Lot 8 Daniel McLeod Rd
- Lot 5 Daniel McLeod Rd
- Lot 6 Daniel McLeod Rd
- Lot 4 Daniel McLeod Rd
- Lot 3 Daniel McLeod Rd
- Lot 15 Daniel McLeod Rd
- Lot 16 Daniel McLeod Rd
- Lot 1 Daniel McLeod Rd
- Lot 7 Daniel McLeod Rd
- Lot 14 Daniel McLeod Rd
- 400 Mcleod Rd
- 308 Lewis St
- 205 N Vance St
Your Personal Tour Guide
Ask me questions while you tour the home.