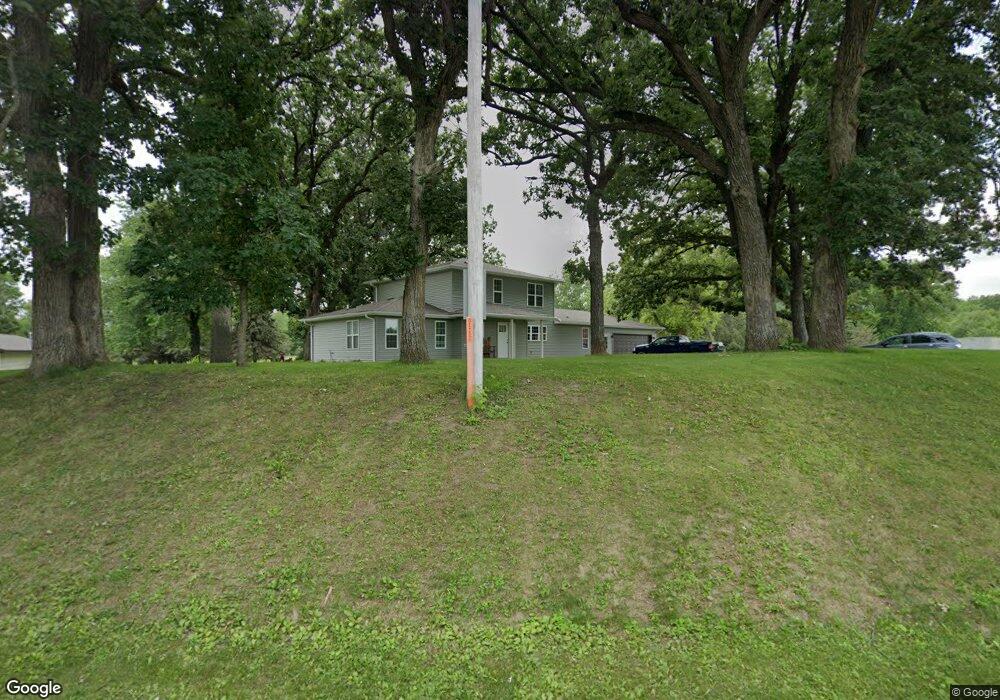
521 E Broadway Leland, IA 50453
Estimated Value: $230,000 - $395,000
4
Beds
2
Baths
2,408
Sq Ft
$133/Sq Ft
Est. Value
About This Home
This home is located at 521 E Broadway, Leland, IA 50453 and is currently estimated at $320,983, approximately $133 per square foot. 521 E Broadway is a home located in Winnebago County with nearby schools including Forest City Elementary School, Forest City Middle School, and Forest City High School.
Ownership History
Date
Name
Owned For
Owner Type
Purchase Details
Closed on
Aug 4, 2005
Sold by
Ambroson James and Ambroson Melanie
Bought by
Keely Brian K and Keely Julie A
Current Estimated Value
Home Financials for this Owner
Home Financials are based on the most recent Mortgage that was taken out on this home.
Original Mortgage
$144,000
Outstanding Balance
$76,814
Interest Rate
6%
Mortgage Type
Adjustable Rate Mortgage/ARM
Estimated Equity
$244,169
Create a Home Valuation Report for This Property
The Home Valuation Report is an in-depth analysis detailing your home's value as well as a comparison with similar homes in the area
Home Values in the Area
Average Home Value in this Area
Purchase History
| Date | Buyer | Sale Price | Title Company |
|---|---|---|---|
| Keely Brian K | $180,000 | None Available |
Source: Public Records
Mortgage History
| Date | Status | Borrower | Loan Amount |
|---|---|---|---|
| Open | Keely Brian K | $144,000 |
Source: Public Records
Tax History Compared to Growth
Tax History
| Year | Tax Paid | Tax Assessment Tax Assessment Total Assessment is a certain percentage of the fair market value that is determined by local assessors to be the total taxable value of land and additions on the property. | Land | Improvement |
|---|---|---|---|---|
| 2025 | $3,900 | $276,370 | $29,700 | $246,670 |
| 2024 | $3,900 | $239,520 | $25,880 | $213,640 |
| 2023 | $3,440 | $238,310 | $25,880 | $212,430 |
| 2022 | $2,884 | $195,920 | $29,120 | $166,800 |
| 2021 | $1,926 | $195,920 | $29,120 | $166,800 |
| 2020 | $2,294 | $120,910 | $27,730 | $93,180 |
| 2019 | $2,462 | $142,530 | $27,730 | $114,800 |
| 2018 | $2,670 | $135,740 | $26,410 | $109,330 |
| 2017 | $2,170 | $135,740 | $26,410 | $109,330 |
| 2016 | $2,096 | $126,130 | $0 | $0 |
| 2015 | $2,096 | $120,120 | $0 | $0 |
| 2014 | $1,924 | $120,120 | $0 | $0 |
Source: Public Records
Map
Nearby Homes