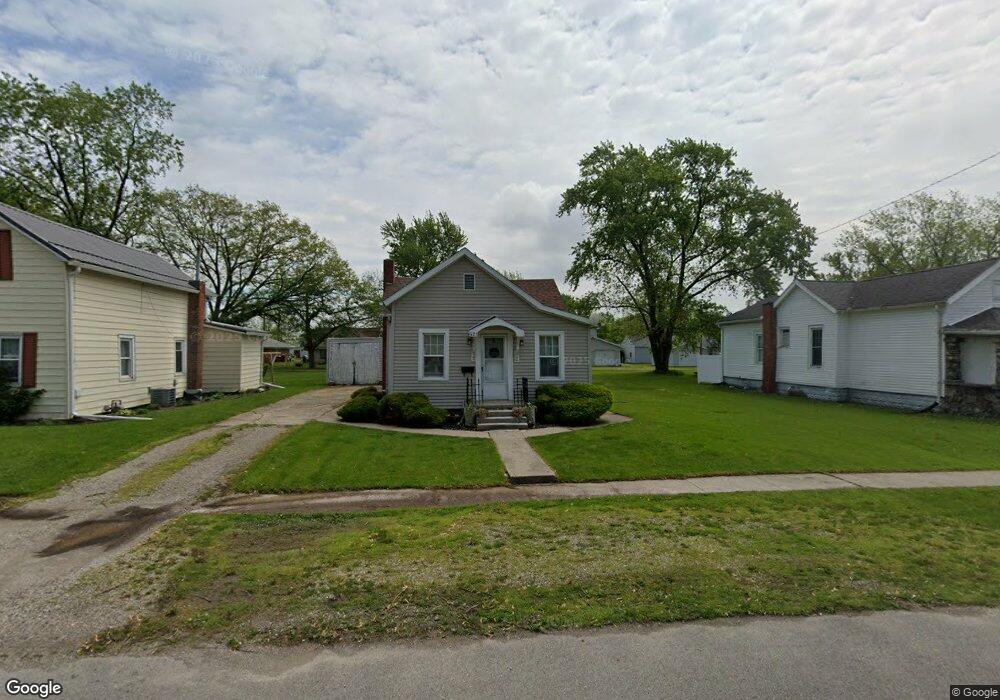
521 Elbert St Defiance, OH 43512
Estimated Value: $78,000 - $95,065
2
Beds
1
Bath
830
Sq Ft
$105/Sq Ft
Est. Value
About This Home
This home is located at 521 Elbert St, Defiance, OH 43512 and is currently estimated at $87,022, approximately $104 per square foot. 521 Elbert St is a home located in Defiance County with nearby schools including Defiance Elementary School, Defiance Middle School, and Defiance High School.
Ownership History
Date
Name
Owned For
Owner Type
Purchase Details
Closed on
Oct 24, 2018
Sold by
Justinger Gary and Justinger Sheila
Bought by
Justinger Kyle
Current Estimated Value
Home Financials for this Owner
Home Financials are based on the most recent Mortgage that was taken out on this home.
Original Mortgage
$33,000
Outstanding Balance
$29,362
Interest Rate
5.5%
Mortgage Type
Land Contract Argmt. Of Sale
Estimated Equity
$57,660
Purchase Details
Closed on
Jan 1, 1996
Bought by
Justinger Gary J and Justinger Sheila R
Purchase Details
Closed on
Feb 8, 1994
Bought by
Justinger Gary J and Justinger Sheila R
Create a Home Valuation Report for This Property
The Home Valuation Report is an in-depth analysis detailing your home's value as well as a comparison with similar homes in the area
Home Values in the Area
Average Home Value in this Area
Purchase History
| Date | Buyer | Sale Price | Title Company |
|---|---|---|---|
| Justinger Kyle | $35,000 | None Available | |
| Justinger Gary J | -- | -- | |
| Justinger Gary J | $26,500 | -- |
Source: Public Records
Mortgage History
| Date | Status | Borrower | Loan Amount |
|---|---|---|---|
| Open | Justinger Kyle | $33,000 |
Source: Public Records
Tax History Compared to Growth
Tax History
| Year | Tax Paid | Tax Assessment Tax Assessment Total Assessment is a certain percentage of the fair market value that is determined by local assessors to be the total taxable value of land and additions on the property. | Land | Improvement |
|---|---|---|---|---|
| 2024 | $765 | $19,870 | $3,360 | $16,510 |
| 2023 | $743 | $19,870 | $3,360 | $16,510 |
| 2022 | $612 | $14,200 | $3,280 | $10,920 |
| 2021 | $612 | $14,200 | $3,280 | $10,920 |
| 2020 | $617 | $14,200 | $3,280 | $10,920 |
| 2019 | $612 | $13,770 | $3,280 | $10,490 |
| 2018 | $595 | $13,770 | $3,280 | $10,490 |
| 2017 | $555 | $13,769 | $3,276 | $10,493 |
| 2016 | $534 | $12,142 | $3,276 | $8,866 |
| 2015 | $258 | $12,142 | $3,276 | $8,866 |
| 2014 | $258 | $12,142 | $3,276 | $8,866 |
| 2013 | $258 | $12,142 | $3,276 | $8,866 |
| 2012 | $258 | $12,142 | $3,276 | $8,866 |
Source: Public Records
Map
Nearby Homes