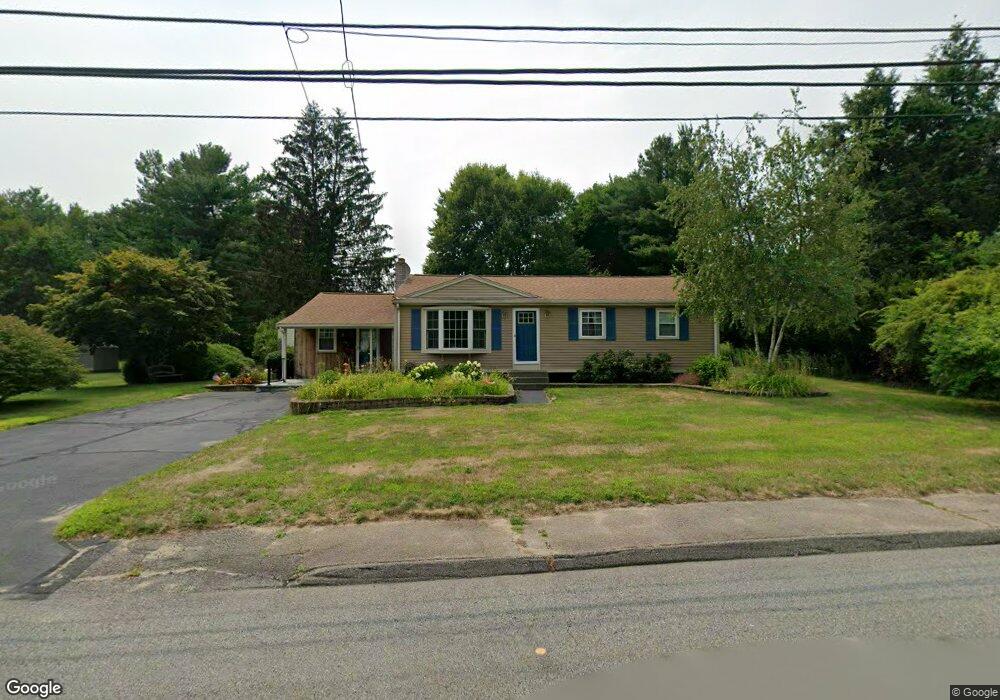
521 Elm St Mansfield, MA 02048
Estimated Value: $551,000 - $626,000
3
Beds
2
Baths
1,399
Sq Ft
$417/Sq Ft
Est. Value
About This Home
This home is located at 521 Elm St, Mansfield, MA 02048 and is currently estimated at $583,446, approximately $417 per square foot. 521 Elm St is a home located in Bristol County with nearby schools including Everett W. Robinson Elementary School, Jordan/Jackson Elementary School, and Harold L. Qualters Middle School.
Ownership History
Date
Name
Owned For
Owner Type
Purchase Details
Closed on
May 7, 2018
Sold by
Arduino Brenda M
Bought by
Brenda M Arduino Ret
Current Estimated Value
Purchase Details
Closed on
Jan 10, 1977
Bought by
Arduino Donald E and Arduino Brenda M
Create a Home Valuation Report for This Property
The Home Valuation Report is an in-depth analysis detailing your home's value as well as a comparison with similar homes in the area
Home Values in the Area
Average Home Value in this Area
Purchase History
| Date | Buyer | Sale Price | Title Company |
|---|---|---|---|
| Brenda M Arduino Ret | -- | -- | |
| Arduino Donald E | -- | -- |
Source: Public Records
Mortgage History
| Date | Status | Borrower | Loan Amount |
|---|---|---|---|
| Previous Owner | Arduino Donald E | $125,000 | |
| Previous Owner | Arduino Donald E | $76,000 | |
| Previous Owner | Arduino Donald E | $40,000 |
Source: Public Records
Tax History
| Year | Tax Paid | Tax Assessment Tax Assessment Total Assessment is a certain percentage of the fair market value that is determined by local assessors to be the total taxable value of land and additions on the property. | Land | Improvement |
|---|---|---|---|---|
| 2025 | $6,406 | $486,400 | $241,800 | $244,600 |
| 2024 | $6,024 | $446,200 | $241,800 | $204,400 |
| 2023 | $5,923 | $420,400 | $241,800 | $178,600 |
| 2022 | $5,734 | $378,000 | $223,800 | $154,200 |
| 2021 | $5,526 | $360,500 | $195,900 | $164,600 |
| 2020 | $5,319 | $346,300 | $186,600 | $159,700 |
| 2019 | $4,921 | $323,300 | $155,400 | $167,900 |
| 2018 | $4,544 | $296,500 | $148,200 | $148,300 |
| 2017 | $4,512 | $300,400 | $144,000 | $156,400 |
| 2016 | $4,447 | $288,600 | $137,100 | $151,500 |
| 2015 | $4,094 | $264,100 | $137,100 | $127,000 |
Source: Public Records
Map
Nearby Homes
- 2 Oak St Unit 2B
- 44 Surrey Dr
- 451R Gilbert St
- 14 Claire Ave
- 71 Richardson Ave
- 143 Oak St Unit 10
- 150 Gilbert St
- 250 Mansfield Ave Unit 11
- 343 Godfrey Dr
- 101 Godfrey Dr Unit 101
- 85 Jewell St
- 49 Pheasant Hill Rd
- 5 Village Way Unit C
- 10 Anna Way
- 345 Richardson Ave
- 157 Mansfield Ave Unit 27
- 157 Mansfield Ave Unit 14
- 17 Village Way Unit F
- 128 Tremont St
- 19 Barberry Rd
Your Personal Tour Guide
Ask me questions while you tour the home.