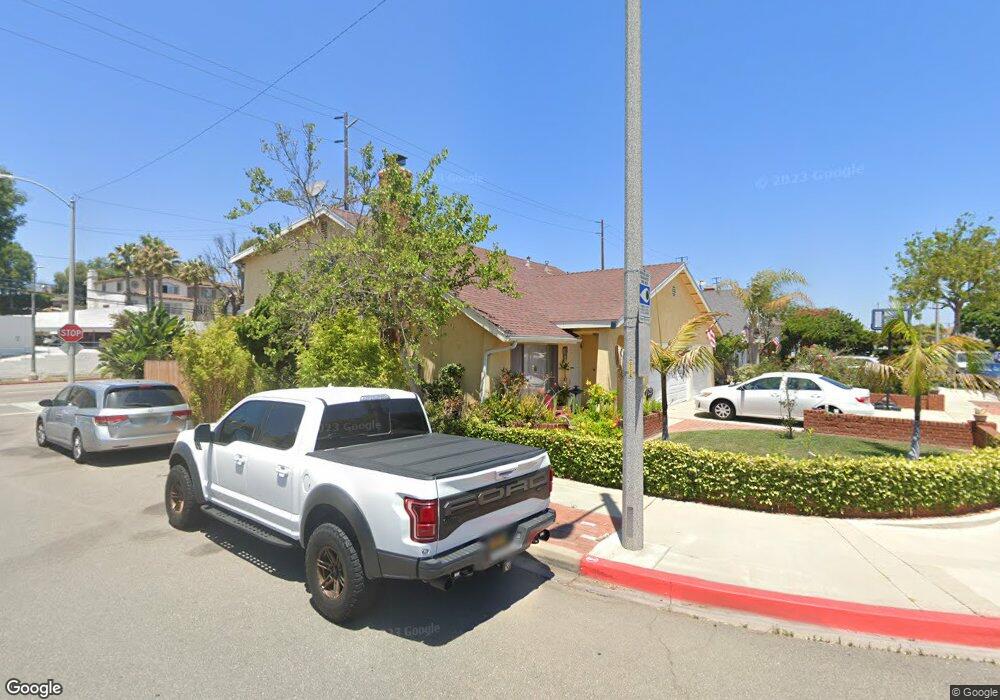
521 Faye Ln Redondo Beach, CA 90277
Estimated Value: $1,868,000 - $2,087,000
4
Beds
3
Baths
2,363
Sq Ft
$837/Sq Ft
Est. Value
About This Home
This home is located at 521 Faye Ln, Redondo Beach, CA 90277 and is currently estimated at $1,977,696, approximately $836 per square foot. 521 Faye Ln is a home located in Los Angeles County with nearby schools including Alta Vista Elementary School, Parras (Nick G.) Middle School, and Redondo Union High School.
Ownership History
Date
Name
Owned For
Owner Type
Purchase Details
Closed on
Aug 6, 2020
Sold by
Bretney Kirk James and Bretney Jocelyn Rivera
Bought by
Bretney Kirk James and Bretney Jocelyn Rivera
Current Estimated Value
Purchase Details
Closed on
Jul 30, 2003
Sold by
Bretney Kirk J and Bretney Jocelyn P
Bought by
Bretney Kirk J and Bretney Jocelyn R
Home Financials for this Owner
Home Financials are based on the most recent Mortgage that was taken out on this home.
Original Mortgage
$372,900
Interest Rate
5.17%
Mortgage Type
Purchase Money Mortgage
Purchase Details
Closed on
Nov 19, 1998
Sold by
Weddington Trust Weddington Genevieve V Tr Ge
Bought by
Bretney Kirk J and Bretney Jocelyn P
Home Financials for this Owner
Home Financials are based on the most recent Mortgage that was taken out on this home.
Original Mortgage
$391,500
Interest Rate
6.91%
Purchase Details
Closed on
Jan 25, 1994
Sold by
Weddington Genevieve V
Bought by
Weddington Genevieve V
Create a Home Valuation Report for This Property
The Home Valuation Report is an in-depth analysis detailing your home's value as well as a comparison with similar homes in the area
Home Values in the Area
Average Home Value in this Area
Purchase History
| Date | Buyer | Sale Price | Title Company |
|---|---|---|---|
| Bretney Kirk James | -- | Accommodation | |
| Bretney Kirk J | -- | Chicago Title Co | |
| Bretney Kirk J | $435,000 | South Coast Title | |
| Weddington Genevieve V | -- | -- |
Source: Public Records
Mortgage History
| Date | Status | Borrower | Loan Amount |
|---|---|---|---|
| Closed | Bretney Kirk J | $372,900 | |
| Closed | Bretney Kirk J | $391,500 |
Source: Public Records
Tax History Compared to Growth
Tax History
| Year | Tax Paid | Tax Assessment Tax Assessment Total Assessment is a certain percentage of the fair market value that is determined by local assessors to be the total taxable value of land and additions on the property. | Land | Improvement |
|---|---|---|---|---|
| 2025 | $8,764 | $722,796 | $545,557 | $177,239 |
| 2024 | $8,764 | $708,624 | $534,860 | $173,764 |
| 2023 | $8,613 | $694,730 | $524,373 | $170,357 |
| 2022 | $8,459 | $681,109 | $514,092 | $167,017 |
| 2021 | $8,292 | $667,755 | $504,012 | $163,743 |
| 2019 | $8,093 | $647,951 | $489,063 | $158,888 |
| 2018 | $7,832 | $635,247 | $479,474 | $155,773 |
| 2016 | $7,572 | $610,581 | $460,856 | $149,725 |
| 2015 | $7,441 | $601,410 | $453,934 | $147,476 |
| 2014 | $7,339 | $589,631 | $445,043 | $144,588 |
Source: Public Records
Map
Nearby Homes
- 603 S Prospect Ave Unit 205
- 603 S Prospect Ave Unit 305
- 824 Camino Real Unit 106
- 830 Camino Real Unit 201
- 824 Camino Real Unit 101
- 810 Camino Real Unit 104
- 641 S Prospect Ave Unit 103
- 635 S Prospect Ave Unit 103
- 1200 Opal St Unit 7
- 1200 Opal St Unit 22
- 619 Camino Real
- 318 S Lucia Ave
- 21513 Palos Verdes Blvd
- 1108 Camino Real Unit 306
- 1108 Camino Real Unit 409
- 904 Knob Hill Ave
- 512 S Gertruda Ave
- 210 S Lucia Ave
- 217 S Irena Ave Unit B
- 220 S Helberta Ave Unit E