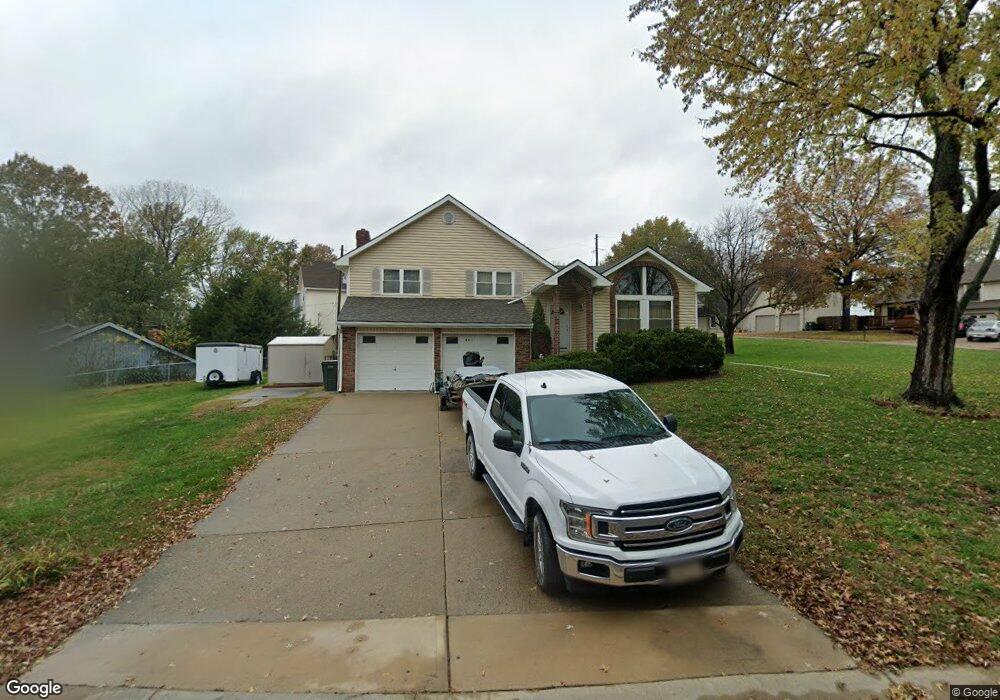
521 Forestglen Ln Lansing, KS 66043
Estimated Value: $290,375 - $309,000
3
Beds
3
Baths
1,541
Sq Ft
$196/Sq Ft
Est. Value
About This Home
This home is located at 521 Forestglen Ln, Lansing, KS 66043 and is currently estimated at $301,594, approximately $195 per square foot. 521 Forestglen Ln is a home located in Leavenworth County with nearby schools including Lansing Elementary School, Lansing Middle 6-8, and Lansing High 9-12.
Ownership History
Date
Name
Owned For
Owner Type
Purchase Details
Closed on
Sep 18, 2025
Sold by
Radford Charles E
Bought by
Ce Radford Family Living Trust and Radford
Current Estimated Value
Purchase Details
Closed on
Aug 8, 2025
Sold by
Sieffert Orville and Sieffert Noelle Colleen
Bought by
Radford Charles E
Purchase Details
Closed on
Jul 31, 2025
Sold by
Neher Jeffery Stephen and Neher Ann Marie
Bought by
Radford Charles E
Purchase Details
Closed on
Sep 10, 2024
Sold by
Radford Charles E
Bought by
Ce Radford Family Living Trust and Radford
Purchase Details
Closed on
May 1, 1989
Bought by
Radford Charles E and Radford Joann J
Home Financials for this Owner
Home Financials are based on the most recent Mortgage that was taken out on this home.
Original Mortgage
$20,000
Interest Rate
11.03%
Mortgage Type
New Conventional
Create a Home Valuation Report for This Property
The Home Valuation Report is an in-depth analysis detailing your home's value as well as a comparison with similar homes in the area
Home Values in the Area
Average Home Value in this Area
Purchase History
| Date | Buyer | Sale Price | Title Company |
|---|---|---|---|
| Ce Radford Family Living Trust | -- | None Listed On Document | |
| Radford Charles E | -- | None Listed On Document | |
| Radford Charles E | -- | None Listed On Document | |
| Ce Radford Family Living Trust | -- | None Listed On Document | |
| Radford Charles E | $95,000 | -- |
Source: Public Records
Mortgage History
| Date | Status | Borrower | Loan Amount |
|---|---|---|---|
| Previous Owner | Radford Charles E | $20,000 |
Source: Public Records
Tax History Compared to Growth
Tax History
| Year | Tax Paid | Tax Assessment Tax Assessment Total Assessment is a certain percentage of the fair market value that is determined by local assessors to be the total taxable value of land and additions on the property. | Land | Improvement |
|---|---|---|---|---|
| 2025 | $4,038 | $32,374 | $5,178 | $27,196 |
| 2024 | $3,836 | $30,256 | $4,143 | $26,113 |
| 2023 | $3,836 | $29,670 | $4,143 | $25,527 |
| 2022 | $3,559 | $26,048 | $3,289 | $22,759 |
| 2021 | $3,294 | $22,954 | $3,289 | $19,665 |
| 2020 | $3,094 | $21,229 | $3,839 | $17,390 |
| 2019 | $3,098 | $21,229 | $3,839 | $17,390 |
| 2018 | $2,867 | $19,675 | $3,284 | $16,391 |
| 2017 | $2,761 | $18,917 | $3,284 | $15,633 |
| 2016 | $2,762 | $18,917 | $3,284 | $15,633 |
| 2015 | $2,754 | $18,917 | $3,284 | $15,633 |
| 2014 | $2,632 | $18,469 | $3,284 | $15,185 |
Source: Public Records
Map
Nearby Homes
- 522 Forestglen Ln
- 104 Olive St
- 546 Hithergreen Dr
- 521 Hillbrook Dr
- 218 E Kay St
- 306 E Kay St
- 202 S Main St
- 310 E Kansas Ave
- 124 S Main St
- 527 S Valley Dr
- 922 Southfork St
- 129 Crestview Ct
- 811 4-H Rd
- 20958 Ida St
- 129 Brookwood St
- 268 Holiday Dr
- 415 Fairlane St
- 866 Clearview Dr
- 875 Clearview Dr
- 13788 McIntyre1 Rd
- 519 Forestglen Ln
- 418 Hithergreen Dr
- 526 Forestglen Ln
- 427 Hithergreen Dr
- 425 Hithergreen Dr
- 515 Forestglen Ln
- 429 Hithergreen Dr
- 524 Forestglen Ln
- 520 Forestglen Ln
- 416 Hithergreen Dr
- 423 Hithergreen Dr
- 431 Hithergreen Dr
- 518 Forestglen Ln
- 434 Hithergreen Dr
- 516 Forestglen Ln
- 433 Hithergreen Dr
- 414 Hithergreen Dr
- 421 Hithergreen Dr
- 436 Hithergreen Dr
- 325 Fawn Valley St