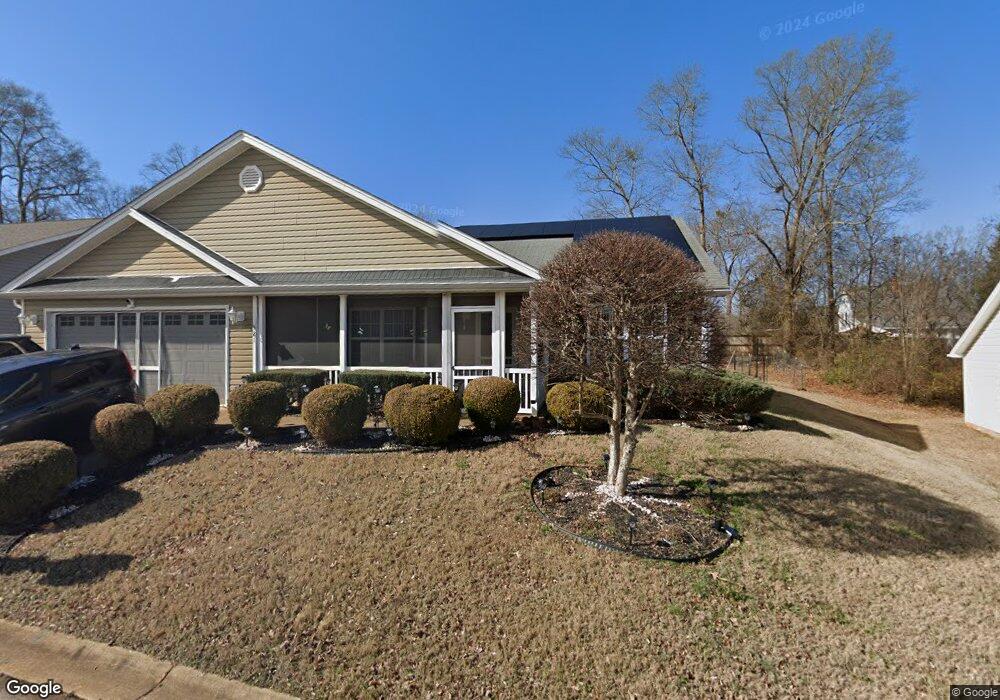
521 Mortar Dr Duncan, SC 29334
Estimated Value: $250,000 - $272,000
3
Beds
2
Baths
1,845
Sq Ft
$142/Sq Ft
Est. Value
About This Home
This home is located at 521 Mortar Dr, Duncan, SC 29334 and is currently estimated at $261,698, approximately $141 per square foot. 521 Mortar Dr is a home located in Spartanburg County with nearby schools including Duncan Elementary School, James Byrnes Freshman Academy, and Beech Springs Intermediate School.
Ownership History
Date
Name
Owned For
Owner Type
Purchase Details
Closed on
Aug 22, 2008
Sold by
Martin Henry Investments Inc
Bought by
Glover Virgil L
Current Estimated Value
Home Financials for this Owner
Home Financials are based on the most recent Mortgage that was taken out on this home.
Original Mortgage
$128,518
Outstanding Balance
$85,501
Interest Rate
6.61%
Mortgage Type
FHA
Estimated Equity
$176,197
Create a Home Valuation Report for This Property
The Home Valuation Report is an in-depth analysis detailing your home's value as well as a comparison with similar homes in the area
Home Values in the Area
Average Home Value in this Area
Purchase History
| Date | Buyer | Sale Price | Title Company |
|---|---|---|---|
| Glover Virgil L | $128,900 | -- |
Source: Public Records
Mortgage History
| Date | Status | Borrower | Loan Amount |
|---|---|---|---|
| Open | Glover Virgil L | $128,518 |
Source: Public Records
Tax History Compared to Growth
Tax History
| Year | Tax Paid | Tax Assessment Tax Assessment Total Assessment is a certain percentage of the fair market value that is determined by local assessors to be the total taxable value of land and additions on the property. | Land | Improvement |
|---|---|---|---|---|
| 2025 | $1,536 | $6,755 | $1,286 | $5,469 |
| 2024 | $1,536 | $6,755 | $1,286 | $5,469 |
| 2023 | $1,536 | $6,755 | $1,286 | $5,469 |
| 2022 | $1,380 | $5,874 | $1,053 | $4,821 |
| 2021 | $1,360 | $5,874 | $1,053 | $4,821 |
| 2020 | $1,341 | $5,874 | $1,053 | $4,821 |
| 2019 | $1,329 | $5,874 | $1,053 | $4,821 |
| 2018 | $1,262 | $5,874 | $1,053 | $4,821 |
| 2017 | $1,132 | $5,108 | $1,120 | $3,988 |
| 2016 | $1,095 | $5,108 | $1,120 | $3,988 |
| 2015 | $1,073 | $5,108 | $1,120 | $3,988 |
| 2014 | $1,065 | $5,108 | $1,120 | $3,988 |
Source: Public Records
Map
Nearby Homes
- 517 Mortar Dr
- 513 Mortar Dr
- 524 Mortar Dr
- 518 Mortar Dr
- 139 Wheeler St
- 143 Wheeler St
- 109 Dahlgren Ct
- 105 Dahlgren Ct
- 509 Mortar Dr
- 578 Mortar Dr
- 528 Mortar Dr
- 510 Mortar Dr
- 223 Hotchkiss Ln
- 137 Wheeler St
- 215 Hotchkiss Ln
- 113 Dahlgren Ct
- 227 Hotchkiss Ln
- 505 Mortar Dr
- 506 Mortar Dr
- 231 Hotchkiss Ln