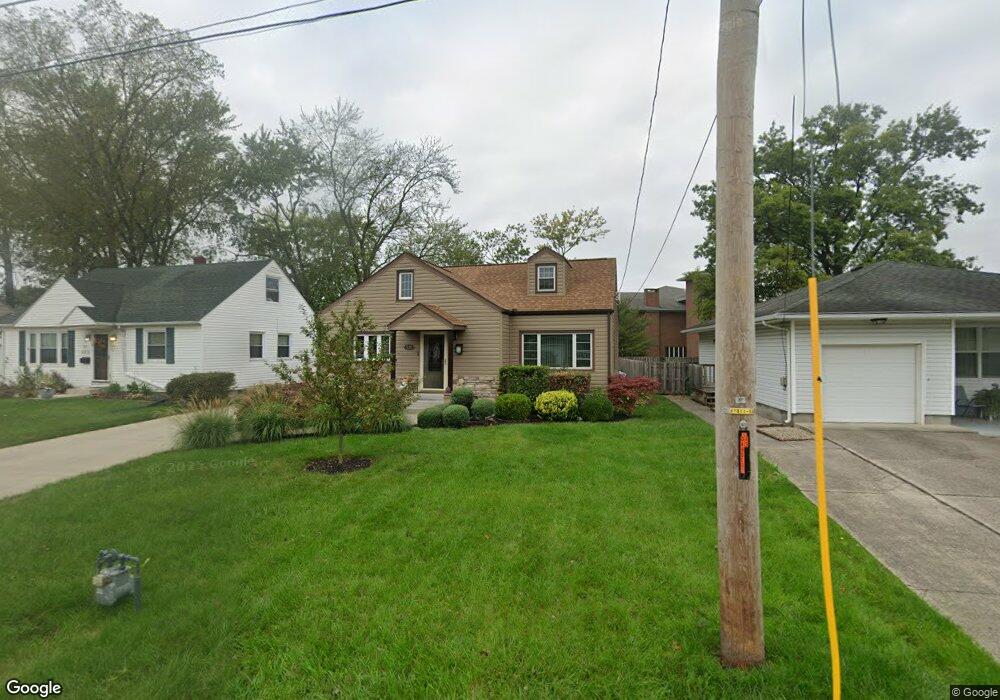
521 N Nixon Ave Lima, OH 45805
Westgate NeighborhoodEstimated Value: $166,000 - $177,330
4
Beds
2
Baths
1,449
Sq Ft
$119/Sq Ft
Est. Value
About This Home
This home is located at 521 N Nixon Ave, Lima, OH 45805 and is currently estimated at $171,833, approximately $118 per square foot. 521 N Nixon Ave is a home located in Allen County with nearby schools including Heritage Elementary School, Lima West Middle School, and Lima North Middle School.
Ownership History
Date
Name
Owned For
Owner Type
Purchase Details
Closed on
Mar 12, 2007
Sold by
Moore Stacey J and Rose Stacey
Bought by
Rose Stacey J and Rose Belgium
Current Estimated Value
Home Financials for this Owner
Home Financials are based on the most recent Mortgage that was taken out on this home.
Original Mortgage
$105,000
Outstanding Balance
$63,590
Interest Rate
6.27%
Mortgage Type
New Conventional
Estimated Equity
$108,243
Purchase Details
Closed on
Feb 13, 1986
Bought by
Moore Stacey J
Create a Home Valuation Report for This Property
The Home Valuation Report is an in-depth analysis detailing your home's value as well as a comparison with similar homes in the area
Home Values in the Area
Average Home Value in this Area
Purchase History
| Date | Buyer | Sale Price | Title Company |
|---|---|---|---|
| Rose Stacey J | -- | None Available | |
| Moore Stacey J | -- | -- |
Source: Public Records
Mortgage History
| Date | Status | Borrower | Loan Amount |
|---|---|---|---|
| Open | Rose Stacey J | $105,000 |
Source: Public Records
Tax History Compared to Growth
Tax History
| Year | Tax Paid | Tax Assessment Tax Assessment Total Assessment is a certain percentage of the fair market value that is determined by local assessors to be the total taxable value of land and additions on the property. | Land | Improvement |
|---|---|---|---|---|
| 2024 | $1,649 | $46,210 | $6,480 | $39,730 |
| 2023 | $1,531 | $37,250 | $5,220 | $32,030 |
| 2022 | $1,540 | $37,250 | $5,220 | $32,030 |
| 2021 | $1,583 | $36,060 | $4,030 | $32,030 |
| 2020 | $1,485 | $29,890 | $3,780 | $26,110 |
| 2019 | $1,485 | $29,890 | $3,780 | $26,110 |
| 2018 | $1,461 | $29,820 | $3,780 | $26,040 |
| 2017 | $1,339 | $26,710 | $3,780 | $22,930 |
| 2016 | $1,352 | $26,710 | $3,780 | $22,930 |
| 2015 | $1,386 | $26,710 | $3,780 | $22,930 |
| 2014 | $1,386 | $27,060 | $3,850 | $23,210 |
| 2013 | $1,348 | $27,060 | $3,850 | $23,210 |
Source: Public Records
Map
Nearby Homes
- 621 Fairfield Dr
- 1517 Allentown Rd
- 1719 Latham Ave
- 1753 Leland Ave
- 109 N Pears Ave
- 1630 W Market St
- 2100 University Blvd
- 1206 Rice Ave
- 1459 W Market St
- 918 Cornell Dr
- 120 S Woodlawn Ave
- 1912 Hillcrest Dr
- 514 N Cable Rd
- 1120 Richie Ave
- 209 N Dale Dr
- 2050 W Market St
- 858 Mackenzie Dr
- 234 S Westwood Dr
- 1023 Leland Ave
- 233 S Kenilworth Ave