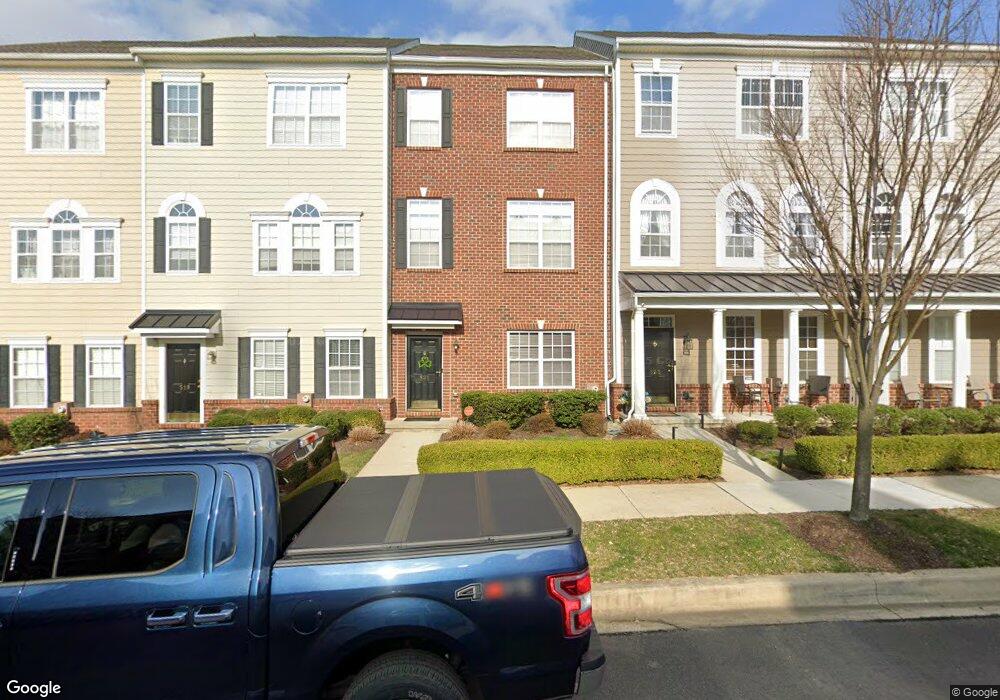
521 Raskob Dr Claymont, DE 19703
Estimated Value: $422,000 - $467,000
3
Beds
4
Baths
1,520
Sq Ft
$290/Sq Ft
Est. Value
About This Home
This home is located at 521 Raskob Dr, Claymont, DE 19703 and is currently estimated at $440,051, approximately $289 per square foot. 521 Raskob Dr is a home located in New Castle County with nearby schools including Claymont Elementary School, Talley Middle School, and Mount Pleasant High School.
Ownership History
Date
Name
Owned For
Owner Type
Purchase Details
Closed on
May 24, 2010
Sold by
Brookview Townhomes Redevelopment Llc
Bought by
Bogdenavage Michael
Current Estimated Value
Home Financials for this Owner
Home Financials are based on the most recent Mortgage that was taken out on this home.
Original Mortgage
$216,180
Outstanding Balance
$145,463
Interest Rate
5.13%
Mortgage Type
New Conventional
Estimated Equity
$294,588
Create a Home Valuation Report for This Property
The Home Valuation Report is an in-depth analysis detailing your home's value as well as a comparison with similar homes in the area
Home Values in the Area
Average Home Value in this Area
Purchase History
| Date | Buyer | Sale Price | Title Company |
|---|---|---|---|
| Bogdenavage Michael | $270,227 | Lawyers Title Insurance Corp |
Source: Public Records
Mortgage History
| Date | Status | Borrower | Loan Amount |
|---|---|---|---|
| Open | Bogdenavage Michael | $216,180 |
Source: Public Records
Tax History Compared to Growth
Tax History
| Year | Tax Paid | Tax Assessment Tax Assessment Total Assessment is a certain percentage of the fair market value that is determined by local assessors to be the total taxable value of land and additions on the property. | Land | Improvement |
|---|---|---|---|---|
| 2024 | $2,791 | $70,800 | $8,500 | $62,300 |
| 2023 | $2,560 | $70,800 | $8,500 | $62,300 |
| 2022 | $2,588 | $70,800 | $8,500 | $62,300 |
| 2021 | $2,585 | $70,800 | $8,500 | $62,300 |
| 2020 | $2,579 | $70,800 | $8,500 | $62,300 |
| 2019 | $2,794 | $70,800 | $8,500 | $62,300 |
| 2018 | $2,476 | $70,800 | $8,500 | $62,300 |
| 2017 | $2,439 | $70,800 | $8,500 | $62,300 |
| 2016 | $2,425 | $70,800 | $8,500 | $62,300 |
| 2015 | $2,238 | $70,800 | $8,500 | $62,300 |
| 2014 | $2,239 | $70,800 | $8,500 | $62,300 |
Source: Public Records
Map
Nearby Homes