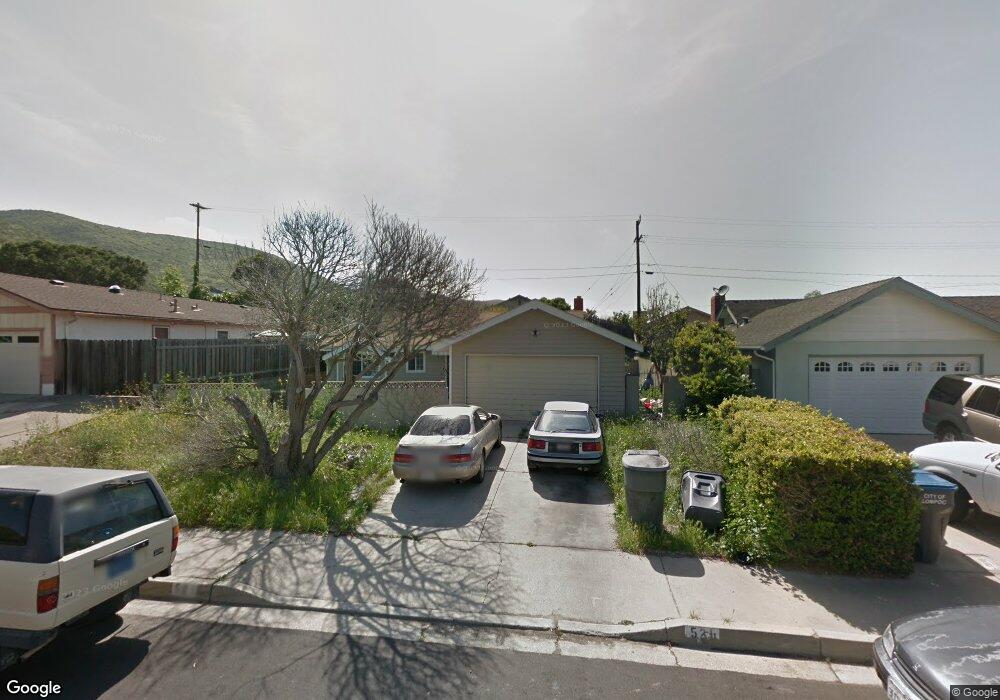
521 S R St Lompoc, CA 93436
Estimated Value: $462,000 - $527,000
3
Beds
2
Baths
1,140
Sq Ft
$429/Sq Ft
Est. Value
About This Home
This home is located at 521 S R St, Lompoc, CA 93436 and is currently estimated at $489,572, approximately $429 per square foot. 521 S R St is a home located in Santa Barbara County with nearby schools including Miguelito Elementary School, Lompoc Valley Middle School, and Lompoc High School.
Ownership History
Date
Name
Owned For
Owner Type
Purchase Details
Closed on
Dec 17, 2012
Sold by
Irigaray Linda
Bought by
Irigaray Jean Antoine and Irigaray Linda Jeanette
Current Estimated Value
Purchase Details
Closed on
Sep 21, 2012
Sold by
Hang Chang
Bought by
Irigaray Linda
Purchase Details
Closed on
Mar 8, 2006
Sold by
Hang See X
Bought by
Hang Chang
Home Financials for this Owner
Home Financials are based on the most recent Mortgage that was taken out on this home.
Original Mortgage
$200,000
Interest Rate
6.19%
Mortgage Type
Stand Alone First
Create a Home Valuation Report for This Property
The Home Valuation Report is an in-depth analysis detailing your home's value as well as a comparison with similar homes in the area
Home Values in the Area
Average Home Value in this Area
Purchase History
| Date | Buyer | Sale Price | Title Company |
|---|---|---|---|
| Irigaray Jean Antoine | -- | None Available | |
| Irigaray Linda | $132,000 | None Available | |
| Hang Chang | -- | Southland Title Corporation |
Source: Public Records
Mortgage History
| Date | Status | Borrower | Loan Amount |
|---|---|---|---|
| Previous Owner | Hang Chang | $200,000 |
Source: Public Records
Tax History
| Year | Tax Paid | Tax Assessment Tax Assessment Total Assessment is a certain percentage of the fair market value that is determined by local assessors to be the total taxable value of land and additions on the property. | Land | Improvement |
|---|---|---|---|---|
| 2025 | $1,976 | $178,546 | $80,037 | $98,509 |
| 2023 | $1,976 | $171,615 | $76,930 | $94,685 |
| 2022 | $1,941 | $168,251 | $75,422 | $92,829 |
| 2021 | $1,961 | $164,953 | $73,944 | $91,009 |
| 2020 | $1,941 | $163,262 | $73,186 | $90,076 |
| 2019 | $1,908 | $160,061 | $71,751 | $88,310 |
| 2018 | $1,879 | $156,924 | $70,345 | $86,579 |
| 2017 | $1,844 | $153,848 | $68,966 | $84,882 |
| 2016 | $1,811 | $150,832 | $67,614 | $83,218 |
| 2014 | $1,772 | $145,658 | $65,295 | $80,363 |
Source: Public Records
Map
Nearby Homes
- 1328 W Willow Ave
- 413 S O Place
- 1311 W Cypress Ave Unit B2
- 400 Coronado Dr
- 23 Village Circle Dr
- 1410 W Apricot Ave
- 425 S J St
- 524 Avalon St
- 1408 W Walnut Ave
- 267 Village Circle Dr
- 112 N X St
- 1011 W Walnut Ave
- 217 N M St
- 215 S H St
- 117 S I St
- 616 University Dr
- 1355 Crown Cir
- 420 N W St
- 205 S E St
- 516 N U St
Your Personal Tour Guide
Ask me questions while you tour the home.