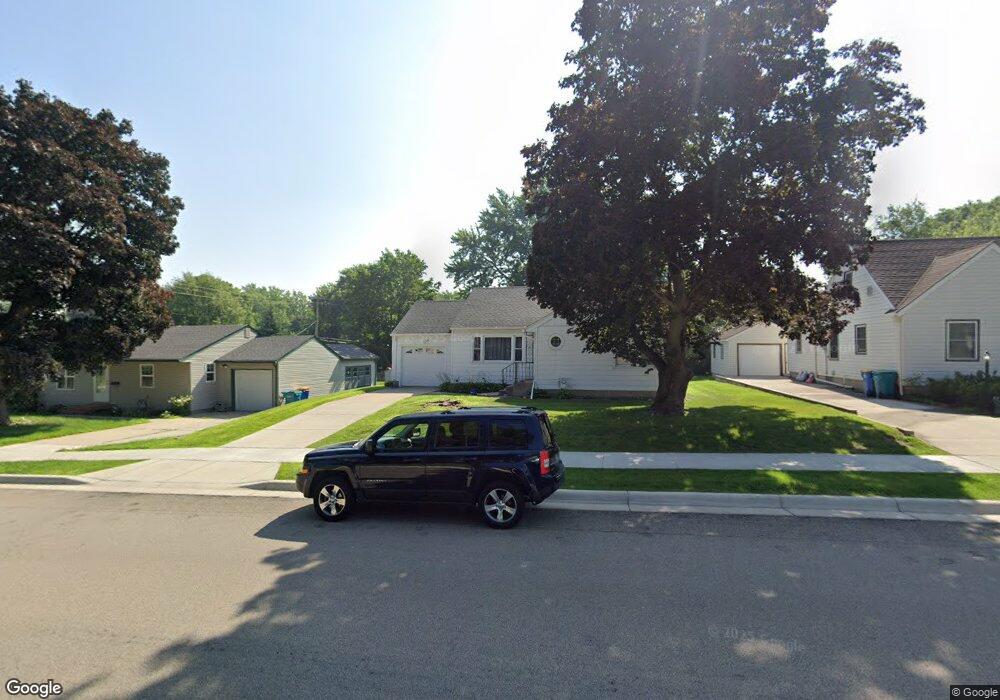
521 Truman Ave Owatonna, MN 55060
Estimated Value: $193,623 - $212,000
2
Beds
2
Baths
1,000
Sq Ft
$206/Sq Ft
Est. Value
About This Home
This home is located at 521 Truman Ave, Owatonna, MN 55060 and is currently estimated at $205,656, approximately $205 per square foot. 521 Truman Ave is a home located in Steele County with nearby schools including Lincoln Elementary School, Owatonna Middle School, and Owatonna Senior High School.
Ownership History
Date
Name
Owned For
Owner Type
Purchase Details
Closed on
Jun 8, 2015
Sold by
Oldham Erin M and Oldham Jeffrey D
Bought by
Stewart Bryanna L
Current Estimated Value
Home Financials for this Owner
Home Financials are based on the most recent Mortgage that was taken out on this home.
Original Mortgage
$101,527
Outstanding Balance
$77,927
Interest Rate
3.5%
Mortgage Type
FHA
Estimated Equity
$127,729
Purchase Details
Closed on
Jun 29, 2007
Sold by
Warner Evelyn C
Bought by
Oldefendt Erin M
Home Financials for this Owner
Home Financials are based on the most recent Mortgage that was taken out on this home.
Original Mortgage
$121,890
Interest Rate
6.26%
Mortgage Type
New Conventional
Purchase Details
Closed on
Oct 17, 2005
Sold by
Warner Lloyd K and Warner Evelyn C
Bought by
Warner Stephen L and Warener Michael J
Create a Home Valuation Report for This Property
The Home Valuation Report is an in-depth analysis detailing your home's value as well as a comparison with similar homes in the area
Home Values in the Area
Average Home Value in this Area
Purchase History
| Date | Buyer | Sale Price | Title Company |
|---|---|---|---|
| Stewart Bryanna L | $103,400 | -- | |
| Oldefendt Erin M | $119,500 | None Available | |
| Warner Evelyn C | -- | None Available | |
| Warner Stephen L | -- | None Available |
Source: Public Records
Mortgage History
| Date | Status | Borrower | Loan Amount |
|---|---|---|---|
| Open | Stewart Bryanna L | $101,527 | |
| Previous Owner | Oldefendt Erin M | $121,890 |
Source: Public Records
Tax History Compared to Growth
Tax History
| Year | Tax Paid | Tax Assessment Tax Assessment Total Assessment is a certain percentage of the fair market value that is determined by local assessors to be the total taxable value of land and additions on the property. | Land | Improvement |
|---|---|---|---|---|
| 2025 | $2,324 | $161,900 | $31,400 | $130,500 |
| 2024 | $2,298 | $152,400 | $27,500 | $124,900 |
| 2023 | $2,382 | $141,800 | $25,900 | $115,900 |
| 2022 | $1,624 | $138,900 | $24,600 | $114,300 |
| 2021 | $1,640 | $112,308 | $22,148 | $90,160 |
| 2020 | $1,590 | $112,014 | $22,148 | $89,866 |
| 2019 | $1,466 | $105,742 | $22,148 | $83,594 |
| 2018 | $1,392 | $103,978 | $22,148 | $81,830 |
| 2017 | $1,310 | $100,058 | $19,012 | $81,046 |
| 2016 | $1,252 | $95,942 | $19,012 | $76,930 |
| 2015 | -- | $0 | $0 | $0 |
| 2014 | -- | $0 | $0 | $0 |
Source: Public Records
Map
Nearby Homes
- 613 E University St
- 604 Prospect St
- 527 E Academy St
- 516 E School St
- 531 E Main St
- 1130 E School St
- 525 E Main St
- 358 E Main St
- 338 South St
- 246 Beech Ave
- 339 South St
- 248 E School St
- 633 11th St SE
- 234 E School St
- 240 South St
- 604 S Elm Ave
- 317 Havana Rd
- 70 Aspen Highland Place
- 609 13th St SE
- 316 E Pearl St
- 521 521 Truman Ave SE
- 515 Truman Ave
- 527 Truman Ave
- 521 521 Se Truman Ave
- 716 Phelps St
- 509 Truman Ave
- 722 Phelps St
- 715 E School St
- 703 E School St
- 703 703 School-Street-e
- 705 Phelps St
- 516 Truman Ave
- 528 Truman Ave
- 721 E School St
- 633 E School St
- 728 Phelps St
- 609 Truman Ave
- 715 Phelps St
- 604 Truman Ave
- 625 E School St