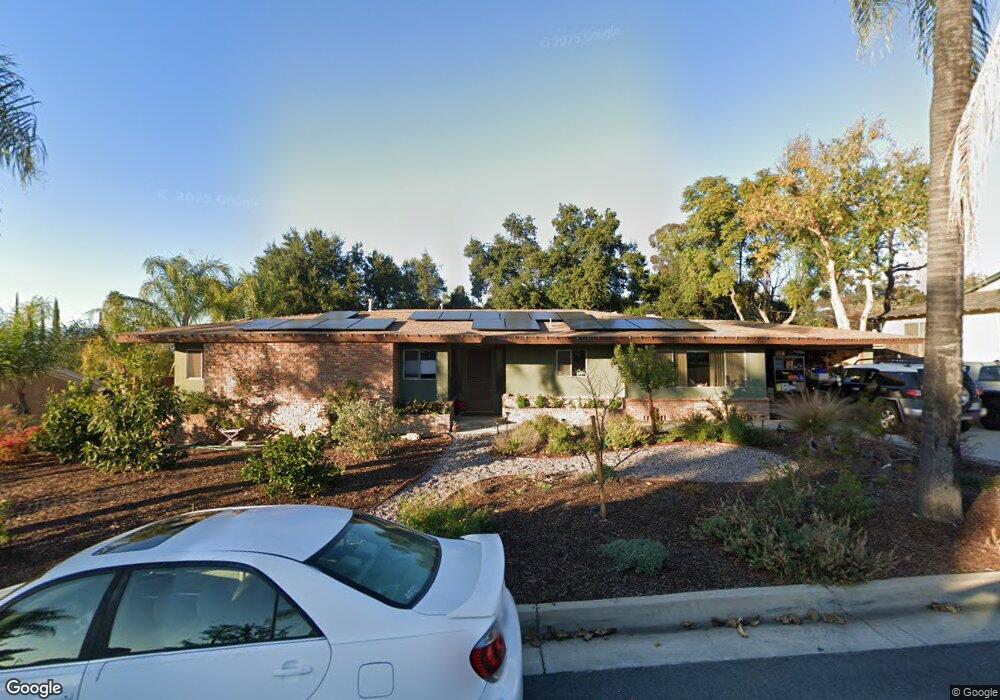
521 Via Vista Dr Redlands, CA 92373
South Redlands NeighborhoodEstimated Value: $748,769 - $838,000
3
Beds
2
Baths
1,934
Sq Ft
$416/Sq Ft
Est. Value
About This Home
This home is located at 521 Via Vista Dr, Redlands, CA 92373 and is currently estimated at $804,442, approximately $415 per square foot. 521 Via Vista Dr is a home located in San Bernardino County with nearby schools including Mariposa Elementary School, Moore Middle School, and Redlands East Valley High School.
Ownership History
Date
Name
Owned For
Owner Type
Purchase Details
Closed on
Nov 11, 2022
Sold by
Mandros Bell Steven Robert
Bought by
Foster Elizabeth Ann
Current Estimated Value
Purchase Details
Closed on
Oct 31, 2022
Sold by
Robert E Bell Trust
Bought by
Foster Elizabeth Ann and Bell Steven Robert
Purchase Details
Closed on
Sep 14, 2016
Sold by
Bell Robert E
Bought by
Bell Robert E and Robert E Bell Trust
Create a Home Valuation Report for This Property
The Home Valuation Report is an in-depth analysis detailing your home's value as well as a comparison with similar homes in the area
Home Values in the Area
Average Home Value in this Area
Purchase History
| Date | Buyer | Sale Price | Title Company |
|---|---|---|---|
| Foster Elizabeth Ann | -- | -- | |
| Foster Elizabeth Ann | -- | -- | |
| Bell Robert E | -- | None Available |
Source: Public Records
Tax History Compared to Growth
Tax History
| Year | Tax Paid | Tax Assessment Tax Assessment Total Assessment is a certain percentage of the fair market value that is determined by local assessors to be the total taxable value of land and additions on the property. | Land | Improvement |
|---|---|---|---|---|
| 2025 | $7,229 | $629,410 | $188,034 | $441,376 |
| 2024 | $7,229 | $617,069 | $184,347 | $432,722 |
| 2023 | $7,765 | $604,969 | $180,732 | $424,237 |
| 2022 | $1,088 | $591,600 | $178,500 | $413,100 |
| 2021 | $1,107 | $84,962 | $15,852 | $69,110 |
| 2020 | $4,585 | $84,090 | $15,689 | $68,401 |
| 2019 | $1,062 | $82,441 | $15,381 | $67,060 |
| 2018 | $1,036 | $80,824 | $15,079 | $65,745 |
| 2017 | $1,028 | $79,239 | $14,783 | $64,456 |
| 2016 | $1,017 | $77,685 | $14,493 | $63,192 |
| 2015 | $1,009 | $76,518 | $14,275 | $62,243 |
| 2014 | $992 | $75,019 | $13,995 | $61,024 |
Source: Public Records
Map
Nearby Homes
- 533 Via Vista Dr
- 419 Marcia St
- 505 E Sunset Dr N
- 608 Via Vista Dr
- 507 E Mariposa Dr
- 1517 Pamela Crest
- 613 E Sunset Dr N
- 620 E Sunset Dr N
- 612 Golden Dr W
- 512 Golden Dr W
- 1435 Patricia Dr
- 1705 Rossmont Dr
- 1525 Lynne Ct
- 0 Garden St Unit EV23054640
- 546 E Mariposa Dr
- 0 E Sunset Dr N
- 221 E Sunset Dr N
- 1615 Halsey St
- 225 Sunset Dr
- 1627 Halsey St
- 527 Via Vista Dr
- 515 Via Vista Dr
- 508 Marilyn Ln
- 518 Via Vista Dr
- 516 Marilyn Ln
- 509 Via Vista Dr
- 524 Via Vista Dr
- 530 Via Vista Dr
- 512 Via Vista Dr
- 506 Marilyn Ln
- 503 Via Vista Dr
- 536 Via Vista Dr
- 509 Marilyn Ln
- 515 Marilyn Ln
- 506 Via Vista Dr
- 458 Marilyn Ln
- 511 Marilyn Ln
- 521 Marilyn Ln
- 449 Via Vista Dr
- 545 Via Vista Dr