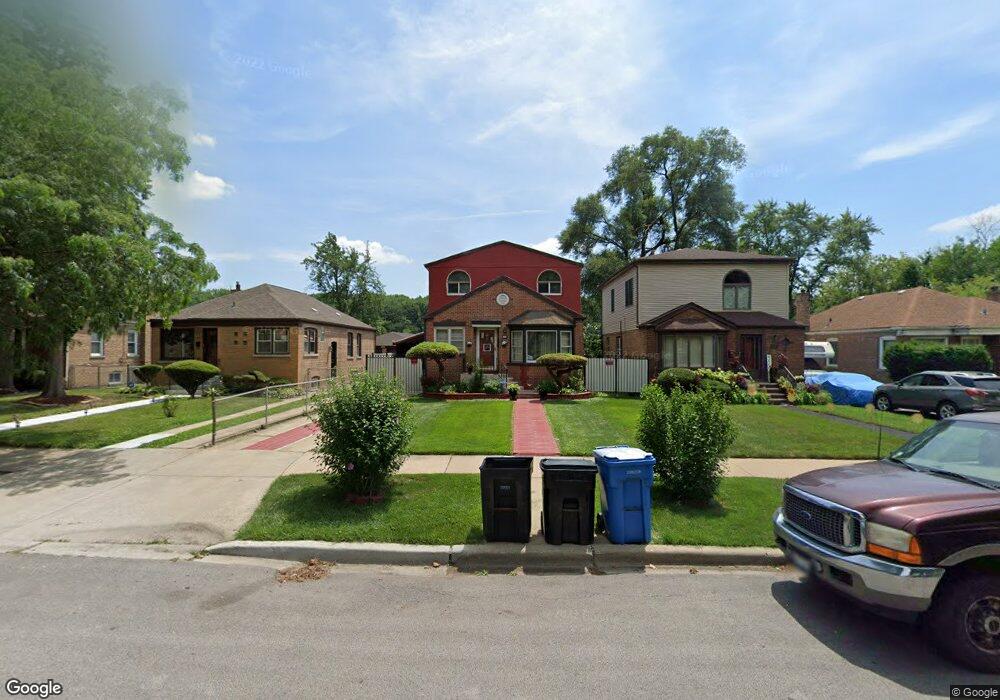
521 W 129th Place Chicago, IL 60628
West Pullman NeighborhoodEstimated Value: $134,000 - $182,919
2
Beds
2
Baths
985
Sq Ft
$151/Sq Ft
Est. Value
About This Home
This home is located at 521 W 129th Place, Chicago, IL 60628 and is currently estimated at $148,730, approximately $150 per square foot. 521 W 129th Place is a home located in Cook County with nearby schools including Ronald Brown Academy and Fenger Academy High School.
Ownership History
Date
Name
Owned For
Owner Type
Purchase Details
Closed on
Mar 25, 2005
Sold by
Hall Damon C
Bought by
Hall Damon C and Hall Annette B
Current Estimated Value
Purchase Details
Closed on
Nov 2, 2000
Sold by
Property Vii Llc
Bought by
Hall Damon and Hall Patricia
Home Financials for this Owner
Home Financials are based on the most recent Mortgage that was taken out on this home.
Original Mortgage
$60,800
Outstanding Balance
$27,474
Interest Rate
11.12%
Estimated Equity
$121,256
Purchase Details
Closed on
Jul 23, 2000
Sold by
Pledged Property Ii Llc
Bought by
Property Vii Llc
Purchase Details
Closed on
Jan 18, 2000
Sold by
Bevil Robert L
Bought by
Pledged Property Ii Llc
Purchase Details
Closed on
Nov 17, 1997
Sold by
Grafft John C
Bought by
Bevil Robert L
Purchase Details
Closed on
Jul 14, 1997
Sold by
Bevil Robert L and Bevil Annie S
Bought by
Grafft John C
Create a Home Valuation Report for This Property
The Home Valuation Report is an in-depth analysis detailing your home's value as well as a comparison with similar homes in the area
Home Values in the Area
Average Home Value in this Area
Purchase History
| Date | Buyer | Sale Price | Title Company |
|---|---|---|---|
| Hall Damon C | -- | -- | |
| Hall Damon | $76,000 | -- | |
| Property Vii Llc | -- | -- | |
| Pledged Property Ii Llc | -- | -- | |
| Bevil Robert L | $45,000 | -- | |
| Grafft John C | $17,000 | -- |
Source: Public Records
Mortgage History
| Date | Status | Borrower | Loan Amount |
|---|---|---|---|
| Open | Hall Damon | $60,800 |
Source: Public Records
Tax History Compared to Growth
Tax History
| Year | Tax Paid | Tax Assessment Tax Assessment Total Assessment is a certain percentage of the fair market value that is determined by local assessors to be the total taxable value of land and additions on the property. | Land | Improvement |
|---|---|---|---|---|
| 2024 | $1,135 | $12,000 | $5,920 | $6,080 |
| 2023 | $1,064 | $12,001 | $4,934 | $7,067 |
| 2022 | $1,064 | $12,001 | $4,934 | $7,067 |
| 2021 | $499 | $11,999 | $4,933 | $7,066 |
| 2020 | $654 | $9,132 | $5,426 | $3,706 |
| 2019 | $640 | $10,036 | $5,426 | $4,610 |
| 2018 | $627 | $10,036 | $5,426 | $4,610 |
| 2017 | $1,093 | $13,043 | $4,933 | $8,110 |
| 2016 | $1,505 | $13,043 | $4,933 | $8,110 |
| 2015 | $1,446 | $13,043 | $4,933 | $8,110 |
| 2014 | $1,434 | $12,400 | $4,440 | $7,960 |
| 2013 | $1,439 | $12,400 | $4,440 | $7,960 |
Source: Public Records
Map
Nearby Homes
- 520 W 129th Place
- 12850 S Parnell Ave
- 703 W 129th Place
- 12837 S Union Ave
- 742 W 129th Place
- 550 W 127th St
- 458 W 127th St
- 12837 S Green St
- 443 W 126th Place
- 12600 S Stewart Ave
- 454 W 126th St
- 442 W 126th St
- 12546 S Stewart Ave
- 12820 S Sangamon St
- 12552 S Harvard Ave
- 12552 S Union Ave
- 12739 S Sangamon St
- 934 W Vermont Ave
- 445 W 125th St
- 12617 S Wentworth Ave
- 525 W 129th Place
- 517 W 129th Place
- 529 W 129th Place
- 515 W 129th Place
- 533 W 129th Place
- 533 W 129th Place
- 511 W 129th Place
- 537 W 129th Place
- 507 W 129th Place
- 541 W 129th Place
- 501 W 129th Place
- 545 W 129th Place
- 516 W 129th Place
- 512 W 129th Place
- 463 W 129th Place
- 508 W 129th Place
- 534 W 129th Place
- 549 W 129th Place
- 504 W 129th Place
- 540 W 129th Place