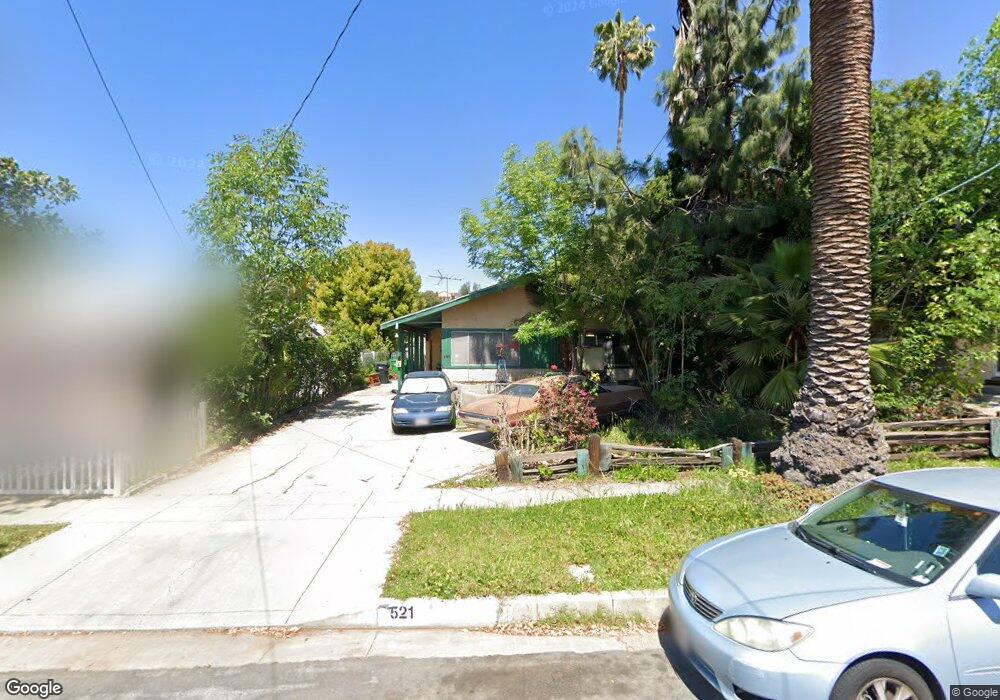
521 W 3rd St Unit A San Dimas, CA 91773
Estimated Value: $808,000 - $1,051,000
3
Beds
2
Baths
1,430
Sq Ft
$636/Sq Ft
Est. Value
About This Home
This home is located at 521 W 3rd St Unit A, San Dimas, CA 91773 and is currently estimated at $909,740, approximately $636 per square foot. 521 W 3rd St Unit A is a home located in Los Angeles County with nearby schools including Fred Ekstrand Elementary School, Lone Hill Middle School, and San Dimas High School.
Ownership History
Date
Name
Owned For
Owner Type
Purchase Details
Closed on
Feb 1, 2023
Sold by
New Heights Investments Inc
Bought by
Hui Pok Cheung
Current Estimated Value
Purchase Details
Closed on
Mar 15, 2022
Sold by
Duane Jenson Gary
Bought by
Douglas-Johnson Trenice M
Purchase Details
Closed on
Mar 4, 2022
Sold by
Gary Duane Jenson Trust
Bought by
New Heights Investments Inc
Purchase Details
Closed on
Aug 18, 2020
Sold by
Jenson Gary D
Bought by
Jenson Gary Duane and The Gary Duane Jenson Trust
Purchase Details
Closed on
Oct 28, 2014
Sold by
Jenson Gary D
Bought by
Jenson Gary D
Home Financials for this Owner
Home Financials are based on the most recent Mortgage that was taken out on this home.
Original Mortgage
$501,000
Interest Rate
2.9%
Mortgage Type
Reverse Mortgage Home Equity Conversion Mortgage
Purchase Details
Closed on
Dec 8, 1998
Sold by
Jenson Gary D
Bought by
Jenson Gary D and Jenson Julia A
Create a Home Valuation Report for This Property
The Home Valuation Report is an in-depth analysis detailing your home's value as well as a comparison with similar homes in the area
Home Values in the Area
Average Home Value in this Area
Purchase History
| Date | Buyer | Sale Price | Title Company |
|---|---|---|---|
| Hui Pok Cheung | $813,000 | Old Republic Title Company | |
| Douglas-Johnson Trenice M | -- | -- | |
| New Heights Investments Inc | $605,000 | Old Republic Title | |
| Douglas-Johnson Trenice M | -- | -- | |
| Jenson Gary Duane | -- | None Available | |
| Jenson Gary D | -- | Placer Title Company | |
| Jenson Gary D | -- | -- |
Source: Public Records
Mortgage History
| Date | Status | Borrower | Loan Amount |
|---|---|---|---|
| Previous Owner | Jenson Gary D | $501,000 |
Source: Public Records
Tax History Compared to Growth
Tax History
| Year | Tax Paid | Tax Assessment Tax Assessment Total Assessment is a certain percentage of the fair market value that is determined by local assessors to be the total taxable value of land and additions on the property. | Land | Improvement |
|---|---|---|---|---|
| 2025 | $10,062 | $856,145 | $626,841 | $229,304 |
| 2024 | $10,062 | $839,358 | $614,550 | $224,808 |
| 2023 | $7,549 | $617,100 | $510,000 | $107,100 |
| 2022 | $1,199 | $53,765 | $11,755 | $42,010 |
| 2021 | $1,164 | $52,712 | $11,525 | $41,187 |
| 2019 | $1,142 | $51,150 | $11,184 | $39,966 |
| 2018 | $1,015 | $50,148 | $10,965 | $39,183 |
| 2016 | $960 | $48,202 | $10,540 | $37,662 |
| 2015 | $950 | $47,479 | $10,382 | $37,097 |
| 2014 | $954 | $46,550 | $10,179 | $36,371 |
Source: Public Records
Map
Nearby Homes
- 100 Rawlinsdale Ln
- 409 W 4th St
- 666 Pearlanna Dr
- 649 W Gladstone St
- 230 W 2nd St
- 0 Dallas Rd Unit WS25141209
- 141 W 1st St
- 135 W Nubia St
- 208 E 3rd St
- 801 W Covina Blvd Unit 84
- 801 W Covina Blvd Unit 112
- 801 W Covina Blvd Unit 105
- 801 W Covina Blvd Unit 54
- 1150 W Juanita Ave
- 1138 Las Colinas Way
- 514 San Pablo Ct
- 2556 Charford St
- 404 W Via Vaquero
- 1044 Kent Dr
- 0 E De Anza Heights Dr