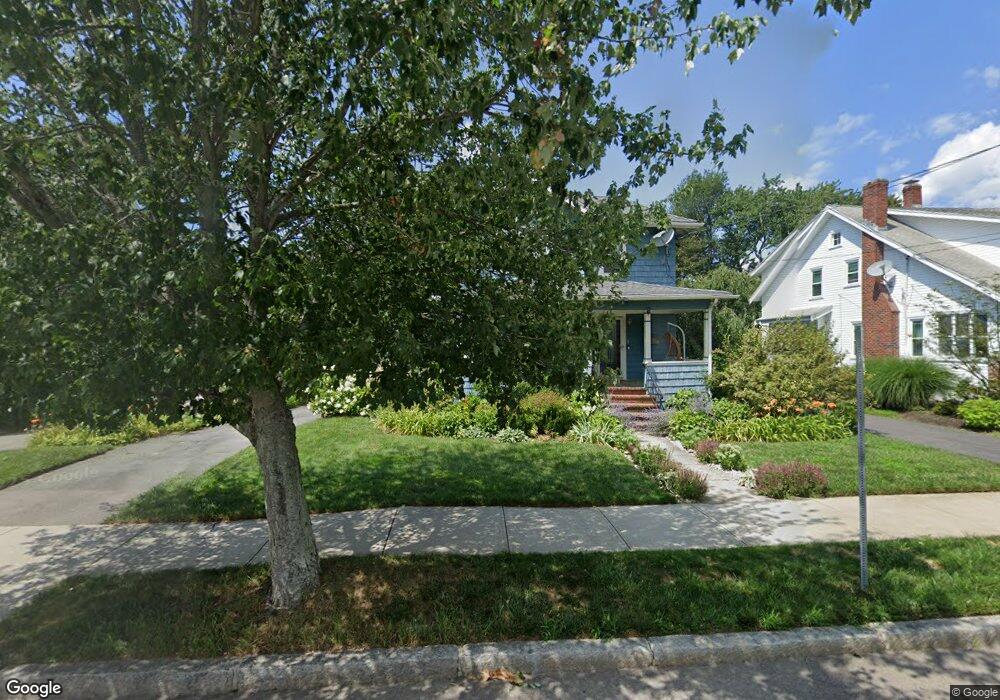
521 W Elm St Brockton, MA 02301
Estimated Value: $529,781 - $588,000
3
Beds
2
Baths
1,642
Sq Ft
$346/Sq Ft
Est. Value
About This Home
This home is located at 521 W Elm St, Brockton, MA 02301 and is currently estimated at $568,945, approximately $346 per square foot. 521 W Elm St is a home located in Plymouth County with nearby schools including Manthala George Jr. School, Hancock Elementary School, and Louis F Angelo Elementary School.
Ownership History
Date
Name
Owned For
Owner Type
Purchase Details
Closed on
Jun 27, 2007
Sold by
Fnma
Bought by
Jean Jeanmarc E and Darius-Jean Alexandra
Current Estimated Value
Home Financials for this Owner
Home Financials are based on the most recent Mortgage that was taken out on this home.
Original Mortgage
$51,700
Outstanding Balance
$31,873
Interest Rate
6.24%
Mortgage Type
Purchase Money Mortgage
Estimated Equity
$537,072
Purchase Details
Closed on
May 23, 2007
Sold by
Santio Anthony F
Bought by
Countrywide Home Loans
Home Financials for this Owner
Home Financials are based on the most recent Mortgage that was taken out on this home.
Original Mortgage
$51,700
Outstanding Balance
$31,873
Interest Rate
6.24%
Mortgage Type
Purchase Money Mortgage
Estimated Equity
$537,072
Purchase Details
Closed on
Sep 10, 1992
Sold by
Nicholaides Neal and Nicholaides Ann
Bought by
Santio Cathleen G and Santio Anthony F
Create a Home Valuation Report for This Property
The Home Valuation Report is an in-depth analysis detailing your home's value as well as a comparison with similar homes in the area
Home Values in the Area
Average Home Value in this Area
Purchase History
| Date | Buyer | Sale Price | Title Company |
|---|---|---|---|
| Jean Jeanmarc E | $258,500 | -- | |
| Federal National Mortgage Association | -- | -- | |
| Countrywide Home Loans | $234,115 | -- | |
| Santio Cathleen G | $107,500 | -- |
Source: Public Records
Mortgage History
| Date | Status | Borrower | Loan Amount |
|---|---|---|---|
| Open | Santio Cathleen G | $227 | |
| Open | Santio Cathleen G | $51,700 |
Source: Public Records
Tax History Compared to Growth
Tax History
| Year | Tax Paid | Tax Assessment Tax Assessment Total Assessment is a certain percentage of the fair market value that is determined by local assessors to be the total taxable value of land and additions on the property. | Land | Improvement |
|---|---|---|---|---|
| 2025 | $5,772 | $476,600 | $149,300 | $327,300 |
| 2024 | $5,474 | $455,400 | $149,300 | $306,100 |
| 2023 | $5,140 | $396,000 | $114,500 | $281,500 |
| 2022 | $4,917 | $352,000 | $104,300 | $247,700 |
| 2021 | $4,568 | $315,000 | $97,700 | $217,300 |
| 2020 | $7,569 | $299,800 | $93,600 | $206,200 |
| 2019 | $7,443 | $291,200 | $87,700 | $203,500 |
| 2018 | $4,164 | $259,300 | $87,700 | $171,600 |
| 2017 | $3,927 | $243,900 | $87,700 | $156,200 |
| 2016 | $4,251 | $244,900 | $83,800 | $161,100 |
| 2015 | $3,762 | $207,300 | $83,800 | $123,500 |
| 2014 | $3,644 | $201,000 | $83,800 | $117,200 |
Source: Public Records
Map
Nearby Homes