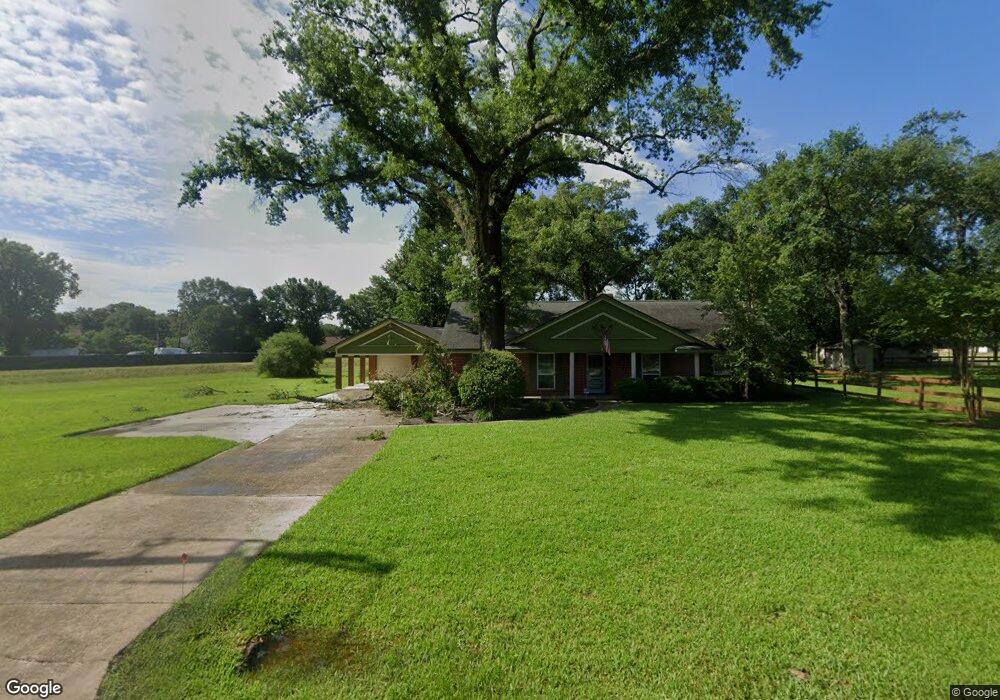
521 W Hufsmith Rd Tomball, TX 77375
Estimated Value: $344,274 - $373,000
3
Beds
3
Baths
2,332
Sq Ft
$155/Sq Ft
Est. Value
About This Home
This home is located at 521 W Hufsmith Rd, Tomball, TX 77375 and is currently estimated at $360,319, approximately $154 per square foot. 521 W Hufsmith Rd is a home located in Harris County with nearby schools including Tomball Elementary School, Tomball Intermediate School, and Tomball Junior High School.
Ownership History
Date
Name
Owned For
Owner Type
Purchase Details
Closed on
Jul 22, 2011
Sold by
Lauve Betty L and Lauve Betty Lou
Bought by
Slack Randall D and Slack Debra L
Current Estimated Value
Purchase Details
Closed on
Mar 7, 2000
Sold by
Federal National Mortgage Association
Bought by
Lauve Lee L and Lauve Betty L
Home Financials for this Owner
Home Financials are based on the most recent Mortgage that was taken out on this home.
Original Mortgage
$91,600
Interest Rate
8.29%
Purchase Details
Closed on
Aug 3, 1999
Sold by
Baker Dale L and Baker Dana D
Bought by
Federal National Mortgage Association
Purchase Details
Closed on
May 7, 1996
Sold by
Chelette Anna Faye
Bought by
Baker Dale L and Baker Dana D
Home Financials for this Owner
Home Financials are based on the most recent Mortgage that was taken out on this home.
Original Mortgage
$95,000
Interest Rate
7.67%
Create a Home Valuation Report for This Property
The Home Valuation Report is an in-depth analysis detailing your home's value as well as a comparison with similar homes in the area
Home Values in the Area
Average Home Value in this Area
Purchase History
| Date | Buyer | Sale Price | Title Company |
|---|---|---|---|
| Slack Randall D | -- | Alamo Title Company | |
| Lauve Lee L | -- | Texas American Title Company | |
| Federal National Mortgage Association | $99,000 | -- | |
| Baker Dale L | -- | Title Agency #50 |
Source: Public Records
Mortgage History
| Date | Status | Borrower | Loan Amount |
|---|---|---|---|
| Previous Owner | Lauve Lee L | $91,600 | |
| Previous Owner | Baker Dale L | $95,000 |
Source: Public Records
Tax History Compared to Growth
Tax History
| Year | Tax Paid | Tax Assessment Tax Assessment Total Assessment is a certain percentage of the fair market value that is determined by local assessors to be the total taxable value of land and additions on the property. | Land | Improvement |
|---|---|---|---|---|
| 2025 | $720 | $376,489 | $82,614 | $293,875 |
| 2024 | $720 | $359,361 | $82,614 | $276,747 |
| 2023 | $720 | $297,649 | $82,614 | $215,035 |
| 2022 | $463 | $239,104 | $20,654 | $218,450 |
| 2021 | $4,032 | $165,476 | $20,654 | $144,822 |
| 2020 | $4,050 | $165,476 | $20,654 | $144,822 |
| 2019 | $3,787 | $150,100 | $20,654 | $129,446 |
| 2018 | $1,248 | $150,100 | $20,654 | $129,446 |
| 2017 | $3,782 | $150,100 | $20,654 | $129,446 |
| 2016 | $3,782 | $150,100 | $20,654 | $129,446 |
| 2015 | $3,561 | $150,100 | $20,654 | $129,446 |
| 2014 | $3,561 | $182,981 | $13,769 | $169,212 |
Source: Public Records
Map
Nearby Homes
- 1126 Audrey Trail
- 20734 Open Range Ct
- 18818 Cornelia Fields Ln
- 18723 Buttercup Farms Ln
- 20718 Open Range Ct
- 19951 Epona Creek Dr
- 19935 Epona Creek Dr
- 18707 Buttercup Farms Ln
- 20710 Open Range Ct
- 18826 Cornelia Fields Ln
- 20714 Open Range Ct
- 930 Arbor Pine
- 0 N Sycamore St
- 1314 Pine Brook
- 1315 Big Pines
- 1302 Pine Trail
- 1310 Big Pines
- 1319 Pine Trail
- 1602 Alpine Dr
- Lot 46 Moore St
- 635 Baker Dr
- 623 Baker Dr
- 522 W Hufsmith Rd
- 502 N Pecan Dr
- 506 N Pecan Dr
- 422 N Pecan Dr
- 510 N Pecan Dr
- 514 N Pecan Dr
- 418 N Pecan Dr
- 518 N Pecan Dr
- TBD Baker Dr
- 000 Baker Dr
- 1938 Hickory St
- 1915 Hickory St
- 1919 Hickory St
- 1934 Hickory St
- 1923 Hickory St
- 619 N Hickory St
- 522 N Pecan Dr
- 618 N Magnolia St