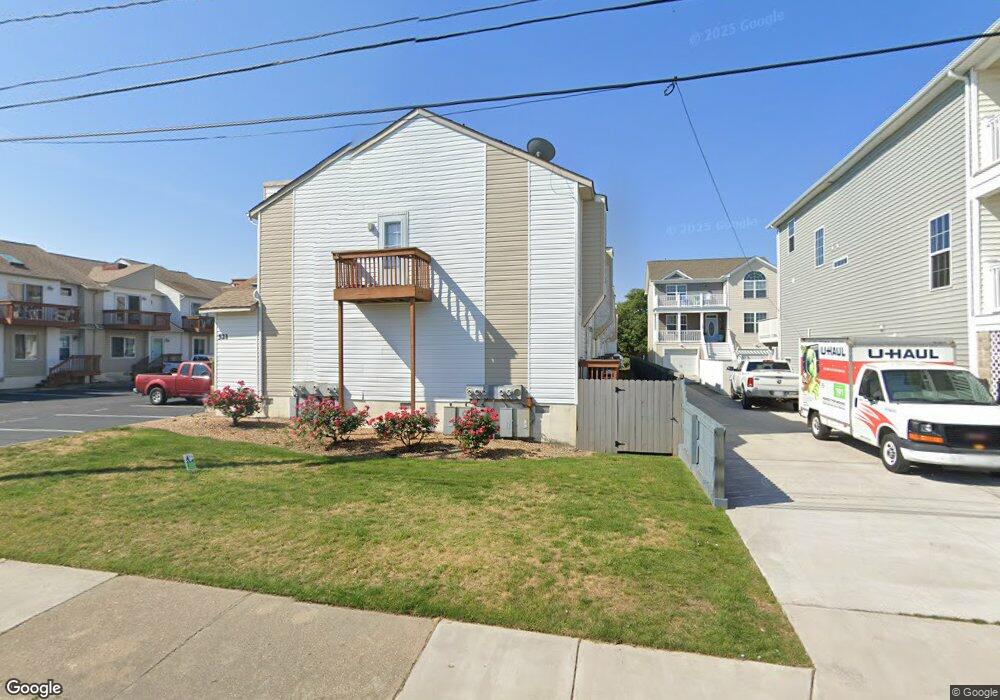
521 W Ocean View Ave Unit E Norfolk, VA 23503
Willoughby NeighborhoodEstimated Value: $207,000 - $234,789
2
Beds
3
Baths
1,300
Sq Ft
$172/Sq Ft
Est. Value
About This Home
This home is located at 521 W Ocean View Ave Unit E, Norfolk, VA 23503 and is currently estimated at $223,447, approximately $171 per square foot. 521 W Ocean View Ave Unit E is a home located in Norfolk City with nearby schools including Ocean View Elementary School, Northside Middle School, and Granby High School.
Ownership History
Date
Name
Owned For
Owner Type
Purchase Details
Closed on
Aug 26, 2021
Sold by
Halvorsen Scott
Bought by
Gonzales Arthur Tex and Gonzales Natalia
Current Estimated Value
Home Financials for this Owner
Home Financials are based on the most recent Mortgage that was taken out on this home.
Original Mortgage
$130,125
Outstanding Balance
$118,146
Interest Rate
2.8%
Mortgage Type
New Conventional
Estimated Equity
$105,301
Purchase Details
Closed on
May 6, 2005
Sold by
Crangle Jeffrey M
Bought by
Halvorsen Scott A
Home Financials for this Owner
Home Financials are based on the most recent Mortgage that was taken out on this home.
Original Mortgage
$183,870
Interest Rate
6.25%
Mortgage Type
VA
Create a Home Valuation Report for This Property
The Home Valuation Report is an in-depth analysis detailing your home's value as well as a comparison with similar homes in the area
Home Values in the Area
Average Home Value in this Area
Purchase History
| Date | Buyer | Sale Price | Title Company |
|---|---|---|---|
| Gonzales Arthur Tex | $173,500 | Titlequest Of Hampton Roads | |
| Halvorsen Scott A | $180,000 | -- |
Source: Public Records
Mortgage History
| Date | Status | Borrower | Loan Amount |
|---|---|---|---|
| Open | Gonzales Arthur Tex | $130,125 | |
| Previous Owner | Halvorsen Scott A | $183,870 |
Source: Public Records
Tax History
| Year | Tax Paid | Tax Assessment Tax Assessment Total Assessment is a certain percentage of the fair market value that is determined by local assessors to be the total taxable value of land and additions on the property. | Land | Improvement |
|---|---|---|---|---|
| 2025 | $2,716 | $217,300 | $37,400 | $179,900 |
| 2024 | $2,720 | $221,100 | $37,400 | $183,700 |
| 2023 | $2,528 | $202,200 | $37,400 | $164,800 |
| 2022 | $2,146 | $171,700 | $28,400 | $143,300 |
| 2021 | $1,990 | $159,200 | $28,400 | $130,800 |
| 2020 | $1,974 | $157,900 | $27,100 | $130,800 |
| 2019 | $1,833 | $146,600 | $27,100 | $119,500 |
| 2018 | $1,638 | $131,000 | $27,100 | $103,900 |
| 2017 | $1,507 | $131,000 | $27,100 | $103,900 |
| 2016 | $1,382 | $157,000 | $27,100 | $129,900 |
| 2015 | $1,600 | $157,000 | $27,100 | $129,900 |
| 2014 | $1,600 | $157,000 | $27,100 | $129,900 |
Source: Public Records
Map
Nearby Homes
- 504 W Ocean View Ave
- 569 W Ocean View Ave
- 583 W Ocean View Ave Unit A
- 600 W Ocean View Ave Unit C
- 728 W Ocean View Ave
- 737 W Ocean View Ave Unit A
- 746 W Ocean View Ave
- 757 W Ocean View Ave
- 407 W Government Ave
- 802 W Ocean View Ave
- 820 Willoughby Bay Ave
- 256 W Balview Ave
- 831 W Ocean View Ave
- 840 W Ocean View Ave
- 831 Little Bay Ave Unit A
- 842 W Ocean View Ave
- 315 Cherry St
- 835 Little Bay Ave Unit 32
- 835 Little Bay Ave Unit E
- 225 A View Ave Unit 204
- 521 W Ocean View Ave Unit E
- 521 W Ocean View Ave Unit C
- 521 W Ocean View Ave Unit B
- 521 W Ocean View Ave Unit A
- 521 W Ocean View Ave Unit I
- 521 W Ocean View Ave Unit H
- 521 W Ocean View Ave Unit G
- 521 W Ocean View Ave Unit F
- 521 W Ocean View Ave Unit D
- 521 W Ocean View Ave
- 521 W Ocean View Ave Unit I (EYE)
- 517 W Ocean View Ave Unit E
- 517 W Ocean View Ave Unit G
- 517 W Ocean View Ave Unit F
- 517 W Ocean View Ave Unit D
- 517 W Ocean View Ave Unit C
- 517 W Ocean View Ave Unit B
- 517 W Ocean View Ave Unit A
- 517 W Ocean View Ave
- 529 W Ocean View Ave
Your Personal Tour Guide
Ask me questions while you tour the home.