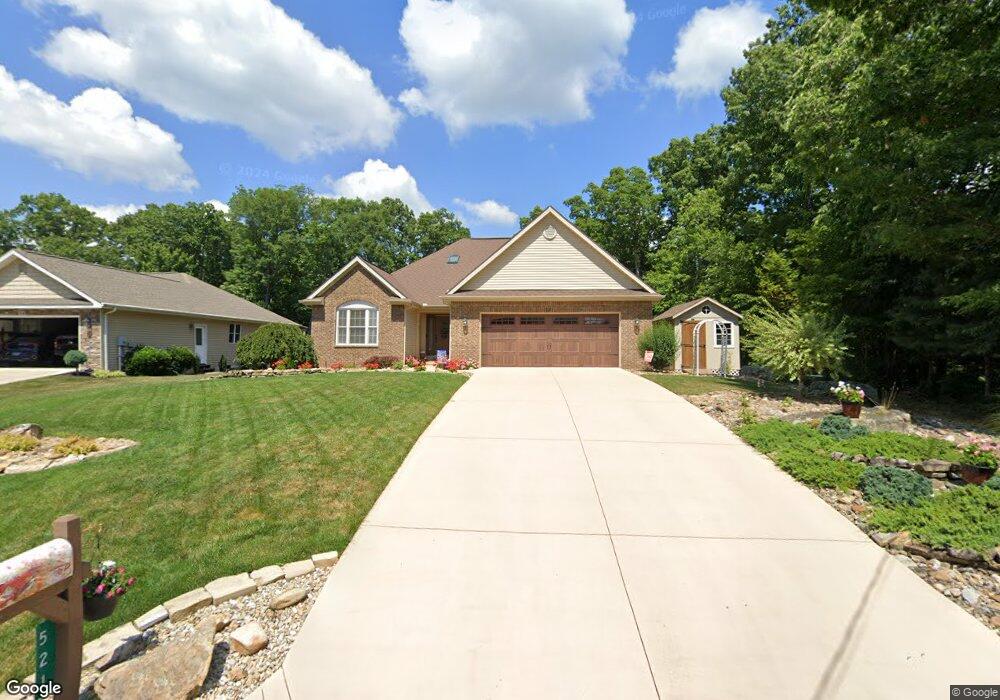
521 Wimberly Rd Crossville, TN 38558
Estimated Value: $413,428 - $469,000
--
Bed
--
Bath
1,750
Sq Ft
$249/Sq Ft
Est. Value
About This Home
This home is located at 521 Wimberly Rd, Crossville, TN 38558 and is currently estimated at $435,857, approximately $249 per square foot. 521 Wimberly Rd is a home located in Cumberland County with nearby schools including Crab Orchard Elementary School and Stone Memorial High School.
Ownership History
Date
Name
Owned For
Owner Type
Purchase Details
Closed on
Jul 9, 2021
Sold by
Pickering Leonard L and The Pickering Living Trust
Bought by
Pickering Ryan Alan and Hess Newton Kristie
Current Estimated Value
Purchase Details
Closed on
Mar 31, 2016
Sold by
Pickering Leonard L
Bought by
Pickering Leonard L Trustee
Purchase Details
Closed on
Mar 23, 2015
Sold by
Pickering Kathleen A
Bought by
Pickering Leonard L
Purchase Details
Closed on
Mar 9, 2015
Sold by
Pickering Leonard L
Bought by
Pickering Leonard L and Pickering Kathleen A
Purchase Details
Closed on
Jan 29, 2014
Sold by
Pickering Leonard L
Bought by
Pickering Leonard L and The Pickering Living Trust
Purchase Details
Closed on
Jan 17, 2011
Sold by
Garrison Steve
Bought by
Pickering Leonard L
Purchase Details
Closed on
May 14, 2009
Bought by
Garrison Steve Dba Steve Garrison Const
Purchase Details
Closed on
Jan 31, 2005
Bought by
National Lots Inc
Purchase Details
Closed on
Apr 2, 1988
Bought by
Harwell Aubrey B
Create a Home Valuation Report for This Property
The Home Valuation Report is an in-depth analysis detailing your home's value as well as a comparison with similar homes in the area
Home Values in the Area
Average Home Value in this Area
Purchase History
| Date | Buyer | Sale Price | Title Company |
|---|---|---|---|
| Pickering Ryan Alan | -- | None Available | |
| Pickering Leonard L Trustee | -- | -- | |
| Pickering Leonard L | -- | -- | |
| Pickering Leonard L | -- | -- | |
| Pickering Leonard L | -- | -- | |
| Pickering Leonard L | $140,000 | -- | |
| Garrison Steve Dba Steve Garrison Const | $10,900 | -- | |
| National Lots Inc | $207,200 | -- | |
| Harwell Aubrey B | $7,000 | -- |
Source: Public Records
Tax History Compared to Growth
Tax History
| Year | Tax Paid | Tax Assessment Tax Assessment Total Assessment is a certain percentage of the fair market value that is determined by local assessors to be the total taxable value of land and additions on the property. | Land | Improvement |
|---|---|---|---|---|
| 2025 | -- | $84,200 | $4,250 | $79,950 |
| 2024 | $932 | $82,075 | $2,125 | $79,950 |
| 2023 | $932 | $82,075 | $0 | $0 |
| 2022 | $932 | $82,075 | $2,125 | $79,950 |
| 2021 | $967 | $61,750 | $2,125 | $59,625 |
| 2020 | $967 | $61,750 | $2,125 | $59,625 |
| 2019 | $967 | $61,750 | $2,125 | $59,625 |
| 2018 | $967 | $61,750 | $2,125 | $59,625 |
| 2017 | $967 | $61,750 | $2,125 | $59,625 |
| 2016 | $957 | $62,625 | $2,125 | $60,500 |
| 2015 | $938 | $62,625 | $2,125 | $60,500 |
| 2014 | $878 | $58,618 | $0 | $0 |
Source: Public Records
Map
Nearby Homes
- 507 Wimberly Rd
- 13 Dovecote Terrace
- 140 Windsor Rd
- 132 Laswell Ln
- 141 Windsor Rd
- 183 Natchez Cir
- 166 Windsor Rd
- 149 Marlboro Dr
- 162 Natchez Cir
- 117 Natchez Cir
- 119 Natchez Cir
- 118 Natchez Cir
- 136 Natchez Cir
- 140 Natchez Cir
- 152 Marlboro Dr
- 613 Westchester Dr
- 605 Westchester Dr
- 610 Westchester Dr
- 680 Westchester Dr
- 132 Crestwood Dr
- 519 Wimberly Rd
- 523 Wimberly Rd
- 517 Wimberly Rd
- 525 Wimberly Rd
- 527 Wimberly Rd
- 515 Wimberly Rd
- 524 Wimberly Rd
- 526 Wimberly Rd
- 513 Wimberly Rd
- 529 Wimberly Rd
- 528 Wimberly Rd
- 518 Wimberly Rd
- 530 Wimberly Rd
- 531 Wimberly Rd
- 511 Wimberly Rd
- 532 Wimberly Rd
- 533 Wimberly Rd
- 102 Marylebone Ln
- 512 Wimberly Rd
- 509 Wimberly Rd