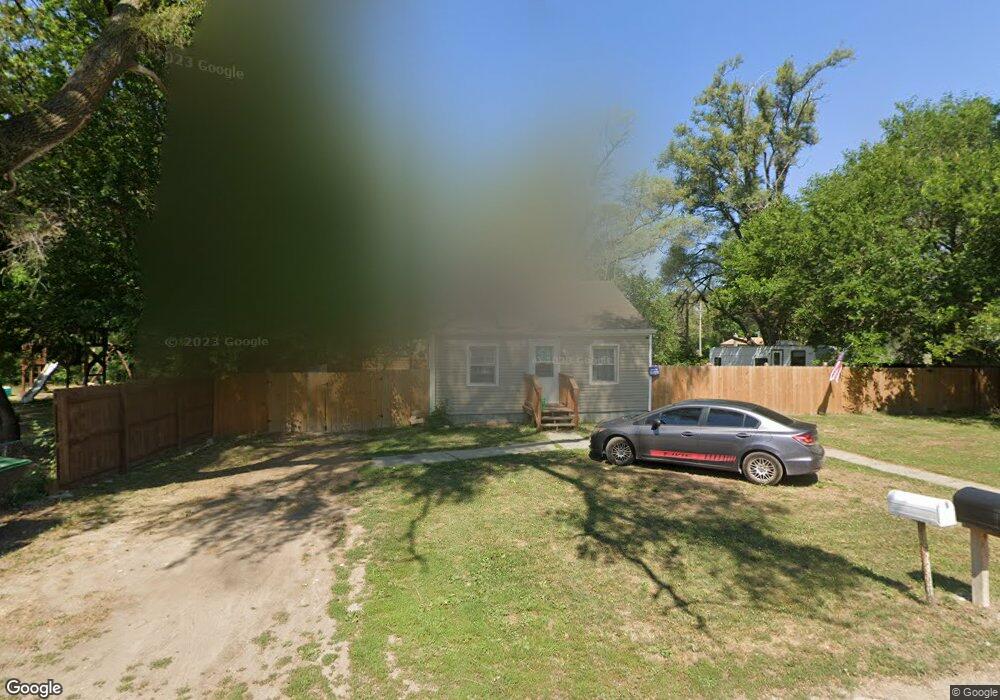
5210 N 9th St E Unit East Omaha, NE 68110
Sherman NeighborhoodEstimated Value: $102,000 - $126,000
1
Bed
1
Bath
576
Sq Ft
$197/Sq Ft
Est. Value
About This Home
This home is located at 5210 N 9th St E Unit East, Omaha, NE 68110 and is currently estimated at $113,237, approximately $196 per square foot. 5210 N 9th St E Unit East is a home located in Douglas County with nearby schools including Sherman Elementary School, McMillan Middle School, and North High School.
Ownership History
Date
Name
Owned For
Owner Type
Purchase Details
Closed on
Jun 6, 2024
Sold by
Kerkar Logan and Coviello Lori
Bought by
Taylor Benji Lee
Current Estimated Value
Home Financials for this Owner
Home Financials are based on the most recent Mortgage that was taken out on this home.
Original Mortgage
$111,550
Outstanding Balance
$110,126
Interest Rate
7.02%
Mortgage Type
New Conventional
Estimated Equity
$3,111
Purchase Details
Closed on
Sep 14, 2021
Sold by
Lincoln Mark
Bought by
Kerkar Logan and Coviello Lori
Purchase Details
Closed on
Apr 17, 2015
Sold by
Bushman Pamela Ann
Bought by
Bear Homes Pc
Purchase Details
Closed on
Nov 14, 2013
Sold by
Vandelay Investments Llc
Bought by
Bushman Pamela Ann
Purchase Details
Closed on
Nov 7, 2013
Sold by
Ferraguti Gary
Bought by
Vandelay Investments Llc
Purchase Details
Closed on
Jun 2, 2005
Sold by
Wright Robert E
Bought by
Gary Ferraguti
Create a Home Valuation Report for This Property
The Home Valuation Report is an in-depth analysis detailing your home's value as well as a comparison with similar homes in the area
Home Values in the Area
Average Home Value in this Area
Purchase History
| Date | Buyer | Sale Price | Title Company |
|---|---|---|---|
| Taylor Benji Lee | $115,000 | Green Title | |
| Kerkar Logan | $75,000 | None Available | |
| Bear Homes Pc | $10,000 | Midwest Title Inc | |
| Bushman Pamela Ann | $10,000 | Nebraska Title Company | |
| Vandelay Investments Llc | $3,280 | None Available | |
| Gary Ferraguti | $19,000 | -- |
Source: Public Records
Mortgage History
| Date | Status | Borrower | Loan Amount |
|---|---|---|---|
| Open | Taylor Benji Lee | $111,550 |
Source: Public Records
Tax History Compared to Growth
Tax History
| Year | Tax Paid | Tax Assessment Tax Assessment Total Assessment is a certain percentage of the fair market value that is determined by local assessors to be the total taxable value of land and additions on the property. | Land | Improvement |
|---|---|---|---|---|
| 2024 | $1,122 | $60,200 | $8,200 | $52,000 |
| 2023 | $1,122 | $53,200 | $8,200 | $45,000 |
| 2022 | $1,136 | $53,200 | $8,200 | $45,000 |
| 2021 | $637 | $30,100 | $8,200 | $21,900 |
| 2020 | $644 | $30,100 | $8,200 | $21,900 |
| 2019 | $183 | $8,500 | $1,100 | $7,400 |
| 2018 | $183 | $8,500 | $1,100 | $7,400 |
| 2017 | $112 | $8,500 | $1,100 | $7,400 |
| 2016 | $112 | $5,200 | $1,000 | $4,200 |
| 2015 | $178 | $8,400 | $3,800 | $4,600 |
| 2014 | $178 | $8,400 | $3,800 | $4,600 |
Source: Public Records
Map
Nearby Homes
- 5111 N 13th St E
- 5415 N 6th Ave
- 1017 Shoal Pointe Dr
- 5323 N 8th St
- 610 Avenue Q
- 1201 Avenue P
- 908 Cachelin Dr
- 4119 N 11th St
- 1207 Cachelin Dr
- 914 O Ave
- 520 Coronado Cir
- 901 Silver Ln
- 1317 Silver Ln
- 4744 N 13th St
- 4545 N 14th St
- 1311 Jaynes St
- 1307 Jaynes St
- 1309 Jaynes St
- 1313 Jaynes St
- 1401 Ellison Ave
- 5210 N 9th St E
- 5216 N 9th St E
- 5217 N 8th St E
- 5211 N 8th St E
- 814 E Camden Ave
- 5223 N 8th St E
- 5223 N 9th St E
- 502 E Fort St
- 802 E Camden Ave
- 902 E Camden Ave
- 5220 N 8th St E
- 5220 N 8th St E
- 5210 N 8th St E
- 5224 N 8th St E
- 910 E Camden Ave
- 5208 N 10th St E
- 820 E Fort St
- 722 E Camden Ave
- 912 E Camden Ave
- 5211 N 2nd St