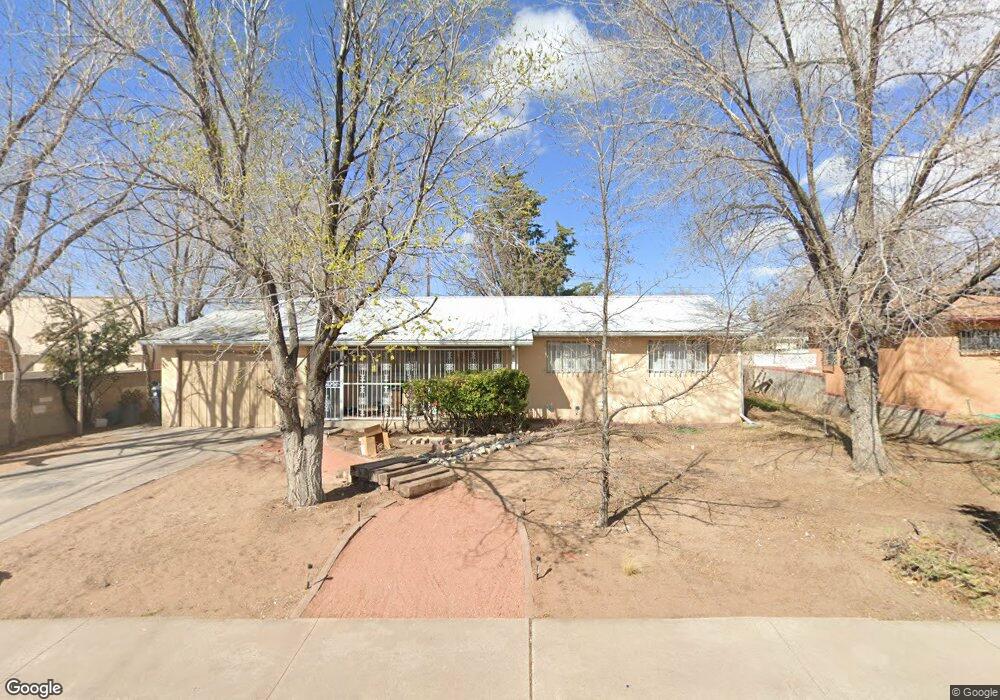
5211 Los Arboles Ave NE Albuquerque, NM 87110
Quigley Park NeighborhoodEstimated Value: $249,000 - $269,000
3
Beds
1
Bath
1,066
Sq Ft
$244/Sq Ft
Est. Value
About This Home
This home is located at 5211 Los Arboles Ave NE, Albuquerque, NM 87110 and is currently estimated at $259,853, approximately $243 per square foot. 5211 Los Arboles Ave NE is a home located in Bernalillo County with nearby schools including Zuni Elementary School, McKinley Middle School, and Del Norte High School.
Ownership History
Date
Name
Owned For
Owner Type
Purchase Details
Closed on
Jul 3, 2024
Sold by
Jennings Judith Susan and Jennings Judy
Bought by
Reiland Kathryn and Jennings Kathryn
Current Estimated Value
Purchase Details
Closed on
Oct 9, 2019
Sold by
Jennings Jerome C and Jennings Jerry
Bought by
Jennings Judith
Create a Home Valuation Report for This Property
The Home Valuation Report is an in-depth analysis detailing your home's value as well as a comparison with similar homes in the area
Home Values in the Area
Average Home Value in this Area
Purchase History
| Date | Buyer | Sale Price | Title Company |
|---|---|---|---|
| Reiland Kathryn | -- | None Listed On Document | |
| Jennings Judith | -- | None Available |
Source: Public Records
Tax History Compared to Growth
Tax History
| Year | Tax Paid | Tax Assessment Tax Assessment Total Assessment is a certain percentage of the fair market value that is determined by local assessors to be the total taxable value of land and additions on the property. | Land | Improvement |
|---|---|---|---|---|
| 2025 | $1,994 | $70,526 | $17,365 | $53,161 |
| 2024 | $1,994 | $47,266 | $10,991 | $36,275 |
| 2023 | $1,961 | $45,889 | $10,671 | $35,218 |
| 2022 | $1,895 | $44,553 | $10,360 | $34,193 |
| 2021 | $1,831 | $43,256 | $10,059 | $33,197 |
| 2020 | $1,801 | $41,996 | $9,766 | $32,230 |
| 2019 | $1,663 | $38,771 | $12,566 | $26,205 |
| 2018 | $1,603 | $38,771 | $12,566 | $26,205 |
| 2017 | $1,554 | $37,642 | $12,200 | $25,442 |
| 2016 | $1,510 | $35,482 | $11,500 | $23,982 |
| 2015 | $34,448 | $34,448 | $11,165 | $23,283 |
| 2014 | $1,420 | $33,445 | $10,840 | $22,605 |
| 2013 | -- | $32,471 | $10,524 | $21,947 |
Source: Public Records
Map
Nearby Homes
- 2826 La Veta Dr NE
- 2800 Cuervo Dr NE
- 3010 Quincy St NE
- 3125 Cuervo Dr NE
- 3119 Truman St NE
- 2920 Cardenas Dr NE
- 2616 Manzano St NE
- 2930 Jefferson St NE
- 2904 Washington St NE
- 3312 Alvarado Dr NE
- 3301 Monroe St NE Unit N145
- 3417 Palomas Dr NE
- 2529 Cardenas Dr NE
- 2504 Valencia Dr NE
- 2819 Montclaire Dr NE
- 5001 Comanche Rd NE
- 2936 Carolina St NE
- 2720 Dakota St NE
- 2354 Valencia Dr NE
- 2333 Cagua Dr NE
- 5215 Los Arboles Ave NE
- 2909 Ortiz Dr NE
- 5210 Los Arboles Ave NE
- 2905 Ortiz Dr NE
- 2901 Madeira Dr NE
- 5216 Los Arboles Ave NE
- 2913 Ortiz Dr NE
- 2833 Madeira Dr NE
- 2911 Madeira Dr NE
- 2917 Ortiz Dr NE
- 2829 Madeira Dr NE
- 2904 Madeira Dr NE
- 2900 Madeira Dr NE
- 2838 Madeira Dr NE
- 2904 Ortiz Dr NE
- 2907 San Mateo Blvd NE Unit 1
- 2900 Ortiz Dr NE
- 2912 Madeira Dr NE
- 2921 Ortiz Dr NE
- 2913 San Mateo Blvd NE