5212 Guadalupe St Unit A Austin, TX 78751
North Loop NeighborhoodEstimated Value: $597,000 - $962,000
--
Bed
2
Baths
2,110
Sq Ft
$381/Sq Ft
Est. Value
About This Home
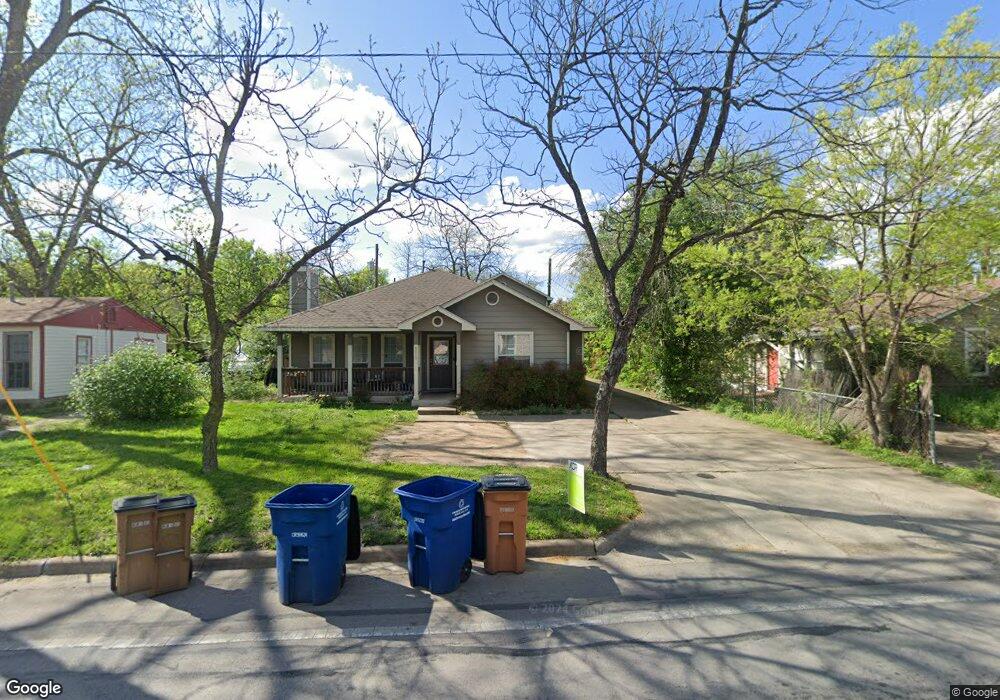
This home is located at 5212 Guadalupe St Unit A, Austin, TX 78751 and is currently estimated at $802,917, approximately $380 per square foot. 5212 Guadalupe St Unit A is a home located in Travis County with nearby schools including Ridgetop Elementary School, Lamar Middle School, and McCallum High School.
Ownership History
Date
Name
Owned For
Owner Type
Purchase Details
Closed on
Feb 1, 2017
Sold by
Dawson Mark and Lupul Dean
Bought by
Dawson Mark and Lupul Dean
Current Estimated Value
Home Financials for this Owner
Home Financials are based on the most recent Mortgage that was taken out on this home.
Original Mortgage
$216,000
Outstanding Balance
$106,435
Interest Rate
3.52%
Mortgage Type
New Conventional
Estimated Equity
$696,482
Purchase Details
Closed on
Jul 9, 2003
Sold by
Rolff Willie F C
Bought by
Dawson Mark and Dawson Tomoko
Home Financials for this Owner
Home Financials are based on the most recent Mortgage that was taken out on this home.
Original Mortgage
$283,500
Interest Rate
5.23%
Mortgage Type
Construction
Purchase Details
Closed on
Jan 24, 2003
Sold by
Mansfield Irene
Bought by
Rolfe Willie C
Purchase Details
Closed on
Dec 18, 2002
Sold by
Rolff Johnetta H
Bought by
Mansfield Irene
Create a Home Valuation Report for This Property
The Home Valuation Report is an in-depth analysis detailing your home's value as well as a comparison with similar homes in the area
Home Values in the Area
Average Home Value in this Area
Purchase History
| Date | Buyer | Sale Price | Title Company |
|---|---|---|---|
| Dawson Mark | -- | Reliant Title Agency | |
| Dawson Mark | -- | Fidelity National Title Co | |
| Rolfe Willie C | -- | -- | |
| Mansfield Irene | -- | -- |
Source: Public Records
Mortgage History
| Date | Status | Borrower | Loan Amount |
|---|---|---|---|
| Open | Dawson Mark | $216,000 | |
| Closed | Dawson Mark | $283,500 |
Source: Public Records
Tax History Compared to Growth
Tax History
| Year | Tax Paid | Tax Assessment Tax Assessment Total Assessment is a certain percentage of the fair market value that is determined by local assessors to be the total taxable value of land and additions on the property. | Land | Improvement |
|---|---|---|---|---|
| 2025 | $16,163 | $816,127 | $437,387 | $378,740 |
| 2023 | $15,873 | $877,317 | $450,000 | $427,317 |
| 2022 | $15,908 | $805,480 | $450,000 | $355,480 |
| 2021 | $14,127 | $648,996 | $275,000 | $373,996 |
| 2020 | $12,511 | $583,285 | $275,000 | $308,285 |
| 2018 | $11,252 | $508,218 | $275,000 | $233,218 |
| 2017 | $10,337 | $463,507 | $240,000 | $223,507 |
| 2016 | $10,388 | $465,821 | $270,000 | $195,821 |
| 2015 | $9,010 | $400,000 | $225,000 | $175,000 |
| 2014 | $9,010 | $378,611 | $225,000 | $153,611 |
Source: Public Records
Map
Nearby Homes
- 5300 Guadalupe St Unit 6202
- 5300 Guadalupe St Unit 108
- 602 W North Loop Blvd Unit A and B
- 602 W North Loop Blvd
- 606 W North Loop Blvd
- 608 Franklin Blvd
- 608 Franklin Blvd Unit A, B, & C
- 700 W North Loop Blvd
- 5202 Huisache St
- 5502 Guadalupe St Unit 1
- 303 Zennia St
- 5107 Leralynn St Unit 201
- 5107 Leralynn St Unit 304
- 500 W 55th 1 2 St Unit A and B
- 500 W 55th 1 2 St
- 200 W 56th St Unit 2104
- 200 W 56th St Unit 5102
- 200 W 56th St Unit 5101
- Congress Plan at Koenig Townhomes
- 200 W 56th St Unit 5103
- 5212 Guadalupe St Unit B
- 5212 Guadalupe St
- 5212-B Guadalupe Street - 1
- 5210 Guadalupe St
- 603 W North Loop Blvd
- 601 W North Loop Blvd
- 605 W North Loop Blvd
- 602 Genard St
- 5208 Guadalupe St
- 604 Genard St
- 604 Genard St Unit 2
- 5215-B Guadalupe St
- 5215 Guadalupe St
- 508 Genard St
- 607 W North Loop Blvd
- 606 Genard St Unit 2
- 606 Genard St Unit 1
- 608 Genard St Unit A
- 608 Genard St Unit B
- 608 Genard St