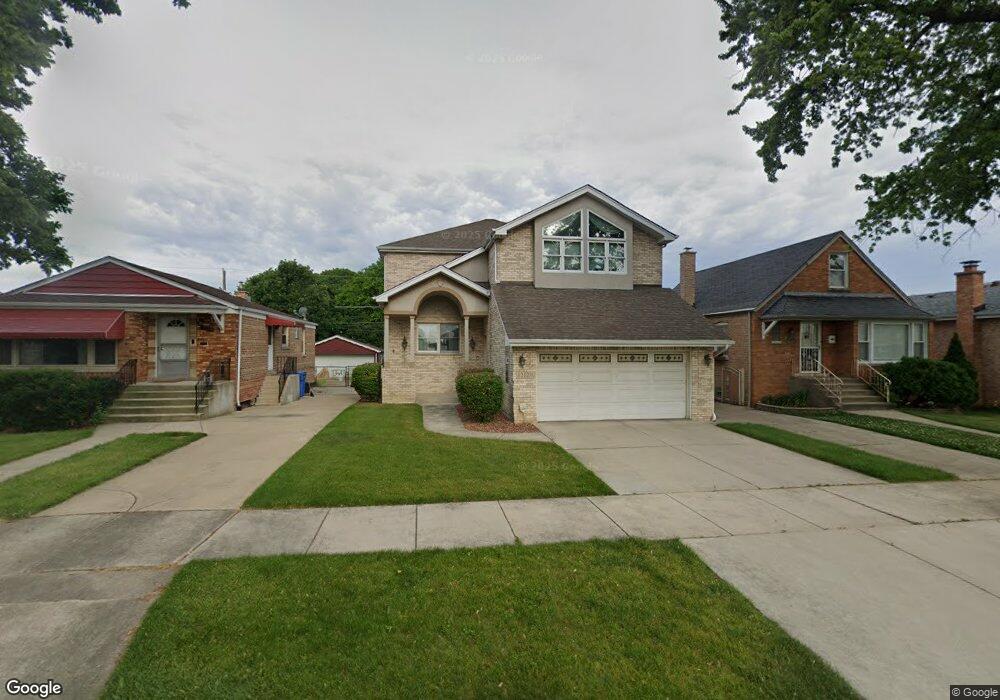
5212 S Nottingham Ave Chicago, IL 60638
Garfield Ridge NeighborhoodEstimated Value: $453,000 - $615,000
4
Beds
2
Baths
2,541
Sq Ft
$217/Sq Ft
Est. Value
About This Home
This home is located at 5212 S Nottingham Ave, Chicago, IL 60638 and is currently estimated at $550,458, approximately $216 per square foot. 5212 S Nottingham Ave is a home located in Cook County with nearby schools including Byrne Elementary School, Kennedy High School, and Peckwas Preparatory Academy.
Ownership History
Date
Name
Owned For
Owner Type
Purchase Details
Closed on
May 2, 2013
Sold by
Power John J
Bought by
Power John J and John J Power Jr Revocable Trust
Current Estimated Value
Purchase Details
Closed on
Oct 31, 2008
Sold by
Power Nicole
Bought by
Power John J
Purchase Details
Closed on
Jun 30, 1909
Sold by
Wilson Davere L and Wilson Norma L
Bought by
Donnelly Power Jr John J and Donnelly Power Nicole
Create a Home Valuation Report for This Property
The Home Valuation Report is an in-depth analysis detailing your home's value as well as a comparison with similar homes in the area
Home Values in the Area
Average Home Value in this Area
Purchase History
| Date | Buyer | Sale Price | Title Company |
|---|---|---|---|
| Power John J | -- | None Available | |
| Power John J | -- | None Available | |
| Donnelly Power Jr John J | $110,000 | Attorneys Natl Title Network |
Source: Public Records
Tax History Compared to Growth
Tax History
| Year | Tax Paid | Tax Assessment Tax Assessment Total Assessment is a certain percentage of the fair market value that is determined by local assessors to be the total taxable value of land and additions on the property. | Land | Improvement |
|---|---|---|---|---|
| 2024 | $7,173 | $52,000 | $7,840 | $44,160 |
| 2023 | $6,955 | $39,779 | $7,000 | $32,779 |
| 2022 | $6,955 | $39,779 | $7,000 | $32,779 |
| 2021 | $7,977 | $43,000 | $7,000 | $36,000 |
| 2020 | $7,049 | $34,541 | $5,600 | $28,941 |
| 2019 | $7,067 | $38,379 | $5,600 | $32,779 |
| 2018 | $7,398 | $40,646 | $5,600 | $35,046 |
| 2017 | $5,977 | $30,958 | $5,040 | $25,918 |
| 2016 | $6,272 | $33,607 | $5,040 | $28,567 |
| 2015 | $5,719 | $33,607 | $5,040 | $28,567 |
| 2014 | $5,548 | $32,239 | $4,760 | $27,479 |
| 2013 | $5,429 | $32,239 | $4,760 | $27,479 |
Source: Public Records
Map
Nearby Homes
- 7235 Park Ave
- 5148 S Newland Ave
- 5359 S Nordica Ave
- 5402 S 73rd Ave
- 7318 W Archer Ave
- 5427 S Newcastle Ave
- 5520 S New England Ave
- 5415 S Oak Park Ave
- 5605 S Nordica Ave
- 5137 S Rutherford Ave
- 7546 W Hanover St
- 5532 S Oak Park Ave
- 7341 56th Place
- 5622 S Oak Park Ave
- 5112 S Nashville Ave
- 5536 S Normandy Ave
- 5745 S Sayre Ave
- 5733 S New England Ave
- 6301 S Harlem Ave
- 5653 S Normandy Ave
- 5208 S Nottingham Ave
- 5216 S Nottingham Ave
- 5204 S Nottingham Ave
- 5220 S Nottingham Ave
- 5200 S Nottingham Ave
- 5224 S Nottingham Ave
- 5213 S Neva Ave
- 5211 S Neva Ave
- 5217 S Neva Ave
- 5209 S Neva Ave
- 5221 S Neva Ave
- 5228 S Nottingham Ave
- 5205 S Neva Ave
- 5225 S Neva Ave
- 5201 S Neva Ave
- 5232 S Nottingham Ave
- 5215 S Nottingham Ave
- 5219 S Nottingham Ave
- 5229 S Neva Ave
- 5205 S Nottingham Ave