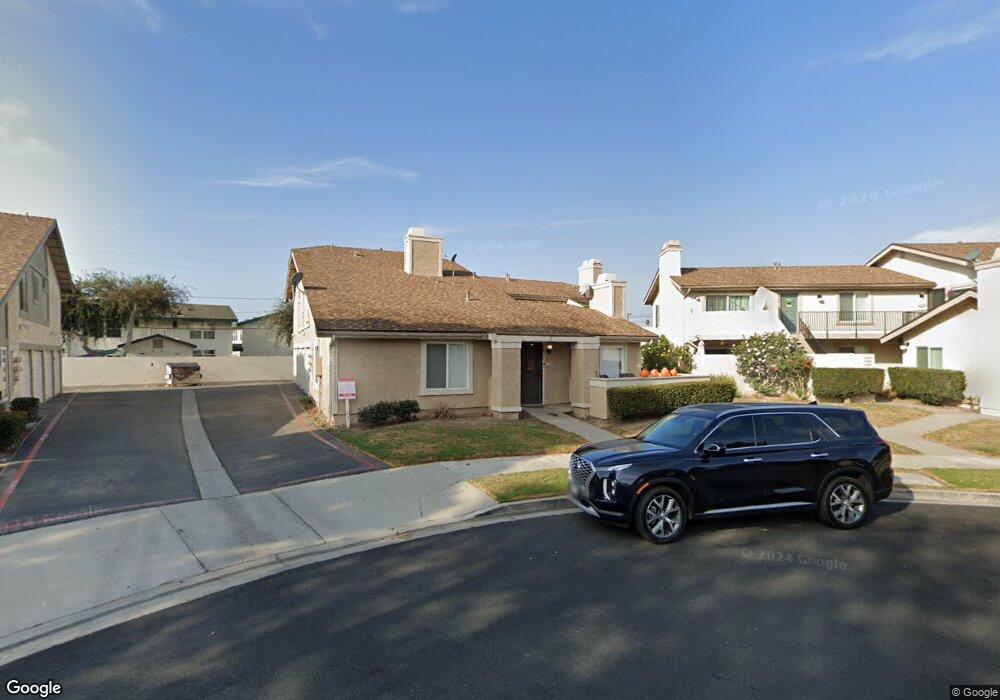
5213 Jefferson Square Unit 46 Oxnard, CA 93033
Cypress NeighborhoodEstimated Value: $371,000 - $427,000
2
Beds
1
Bath
902
Sq Ft
$452/Sq Ft
Est. Value
About This Home
This home is located at 5213 Jefferson Square Unit 46, Oxnard, CA 93033 and is currently estimated at $407,832, approximately $452 per square foot. 5213 Jefferson Square Unit 46 is a home located in Ventura County with nearby schools including Channel Islands High School.
Ownership History
Date
Name
Owned For
Owner Type
Purchase Details
Closed on
Aug 4, 1999
Sold by
Hud
Bought by
Revelez Araceli
Current Estimated Value
Home Financials for this Owner
Home Financials are based on the most recent Mortgage that was taken out on this home.
Original Mortgage
$83,420
Outstanding Balance
$24,422
Interest Rate
7.89%
Estimated Equity
$383,410
Purchase Details
Closed on
Jun 16, 1999
Sold by
Old Kent Mtg Company
Bought by
Hud
Home Financials for this Owner
Home Financials are based on the most recent Mortgage that was taken out on this home.
Original Mortgage
$83,420
Outstanding Balance
$24,422
Interest Rate
7.89%
Estimated Equity
$383,410
Purchase Details
Closed on
Nov 11, 1998
Sold by
Osiris Tapia
Bought by
Old Kent Mtg Company
Purchase Details
Closed on
Nov 8, 1994
Sold by
Reyes Jose
Bought by
Tapia Osiris
Purchase Details
Closed on
May 10, 1994
Sold by
Wilson Mala
Bought by
Tapia Osiris and Reyes Jose
Home Financials for this Owner
Home Financials are based on the most recent Mortgage that was taken out on this home.
Original Mortgage
$81,900
Interest Rate
8.35%
Mortgage Type
FHA
Create a Home Valuation Report for This Property
The Home Valuation Report is an in-depth analysis detailing your home's value as well as a comparison with similar homes in the area
Home Values in the Area
Average Home Value in this Area
Purchase History
| Date | Buyer | Sale Price | Title Company |
|---|---|---|---|
| Revelez Araceli | $86,000 | First American Title Ins Co | |
| Hud | -- | American Title Co | |
| Old Kent Mtg Company | $87,443 | American Title Ins Co | |
| Tapia Osiris | -- | -- | |
| Tapia Osiris | $84,000 | First American Title Ins Co |
Source: Public Records
Mortgage History
| Date | Status | Borrower | Loan Amount |
|---|---|---|---|
| Open | Revelez Araceli | $83,420 | |
| Previous Owner | Tapia Osiris | $81,900 |
Source: Public Records
Tax History
| Year | Tax Paid | Tax Assessment Tax Assessment Total Assessment is a certain percentage of the fair market value that is determined by local assessors to be the total taxable value of land and additions on the property. | Land | Improvement |
|---|---|---|---|---|
| 2025 | $1,427 | $132,147 | $52,857 | $79,290 |
| 2024 | $1,427 | $129,556 | $51,820 | $77,736 |
| 2023 | $1,449 | $127,016 | $50,804 | $76,212 |
| 2022 | $1,362 | $124,526 | $49,808 | $74,718 |
| 2021 | $1,360 | $122,085 | $48,832 | $73,253 |
| 2020 | $1,398 | $120,834 | $48,332 | $72,502 |
| 2019 | $1,344 | $118,466 | $47,385 | $71,081 |
| 2018 | $1,325 | $116,144 | $46,456 | $69,688 |
| 2017 | $1,290 | $113,868 | $45,546 | $68,322 |
| 2016 | $1,230 | $111,636 | $44,653 | $66,983 |
| 2015 | $1,244 | $109,961 | $43,983 | $65,978 |
| 2014 | $1,216 | $107,809 | $43,122 | $64,687 |
Source: Public Records
Map
Nearby Homes
- 5117 Jefferson Square
- 5222 Longfellow Way
- 4910 Justin Way
- 4710 Clover Dr
- 4731 Hamilton Ave
- 5225 Columbus Place
- 5302 Barrymore Dr
- 4340 Highland Ave
- 4614 Concord Way
- 4160 Petit Dr Unit 39
- 320 Columbia Place Unit 46
- 341 Cuesta Del Mar Dr
- 4200 S A St
- 4200 Browning Dr
- 360 Ibsen Place Unit 129
- 5121 Perkins Rd
- 5340 S J St
- 3631 La Costa Place
- 2021 E Bard Rd
- 165 Courtyard Dr Unit 26
- 5217 Jefferson Square Unit 47
- 5217 Jefferson Square
- 5215 Jefferson Square
- 5211 Jefferson Square
- 5203 Jefferson Square
- 5207 Jefferson Square
- 5225 Jefferson Square
- 5201 Jefferson Square
- 5205 Jefferson Square
- 5221 Jefferson Square
- 5227 Jefferson Square
- 5223 Jefferson Square
- 5167 Jefferson Square Unit 56
- 5220 Jefferson Square
- 5163 Jefferson Square
- 5165 Jefferson Square
- 5222 Jefferson Square
- 5226 Jefferson Square
- 5224 Jefferson Square Unit 40
- 5224 Jefferson Square
Your Personal Tour Guide
Ask me questions while you tour the home.