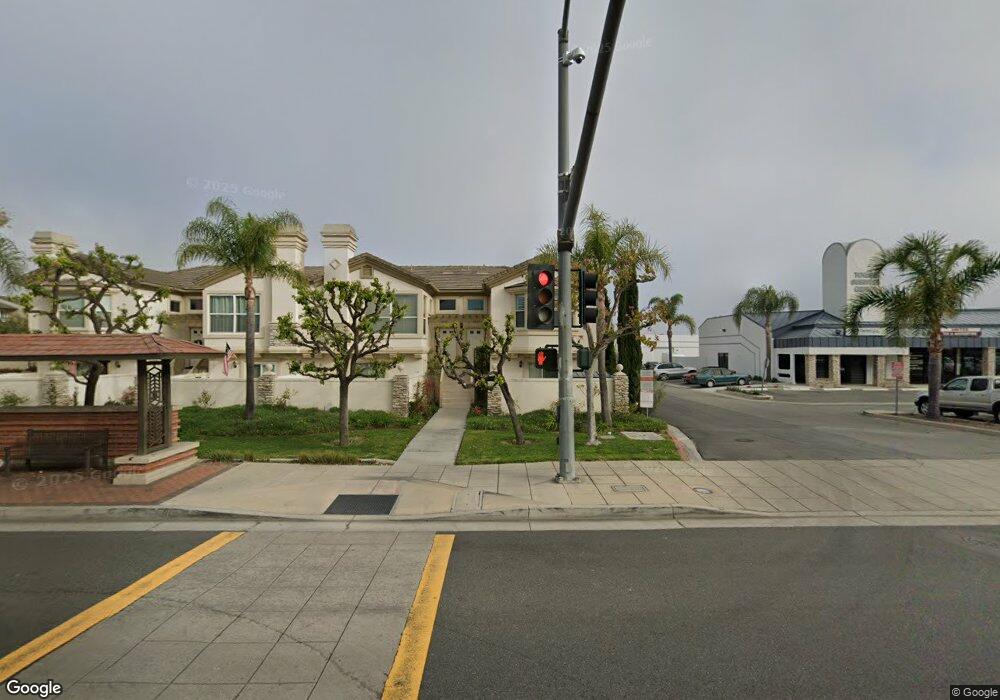
5213 Lincoln Ave Unit 2 Cypress, CA 90630
Estimated Value: $593,716 - $732,000
2
Beds
2
Baths
1,100
Sq Ft
$582/Sq Ft
Est. Value
About This Home
This home is located at 5213 Lincoln Ave Unit 2, Cypress, CA 90630 and is currently estimated at $640,179, approximately $581 per square foot. 5213 Lincoln Ave Unit 2 is a home located in Orange County with nearby schools including Clara J. King Elementary School, Walker Junior High School, and John F. Kennedy High School.
Ownership History
Date
Name
Owned For
Owner Type
Purchase Details
Closed on
Jul 30, 2024
Sold by
Stanley Steven L and Stanley Susan L
Bought by
Steven And Susan Stanley Living Trust and Stanley
Current Estimated Value
Purchase Details
Closed on
Jan 30, 2009
Sold by
Samuelson David Alan
Bought by
Stanley Steven L and Stanley Susan L
Home Financials for this Owner
Home Financials are based on the most recent Mortgage that was taken out on this home.
Original Mortgage
$140,300
Interest Rate
5.03%
Mortgage Type
Purchase Money Mortgage
Purchase Details
Closed on
Dec 1, 2004
Sold by
Bonanni Properties & D S Products
Bought by
Samuelson David Alan
Home Financials for this Owner
Home Financials are based on the most recent Mortgage that was taken out on this home.
Original Mortgage
$99,800
Interest Rate
5.8%
Mortgage Type
Purchase Money Mortgage
Create a Home Valuation Report for This Property
The Home Valuation Report is an in-depth analysis detailing your home's value as well as a comparison with similar homes in the area
Home Values in the Area
Average Home Value in this Area
Purchase History
| Date | Buyer | Sale Price | Title Company |
|---|---|---|---|
| Steven And Susan Stanley Living Trust | -- | None Listed On Document | |
| Stanley Steven L | $152,500 | Ticor Title Orange Branch | |
| Samuelson David Alan | $175,000 | Orange Coast Title |
Source: Public Records
Mortgage History
| Date | Status | Borrower | Loan Amount |
|---|---|---|---|
| Previous Owner | Stanley Steven L | $140,300 | |
| Previous Owner | Samuelson David Alan | $99,800 | |
| Closed | Samuelson David Alan | $57,700 |
Source: Public Records
Tax History
| Year | Tax Paid | Tax Assessment Tax Assessment Total Assessment is a certain percentage of the fair market value that is determined by local assessors to be the total taxable value of land and additions on the property. | Land | Improvement |
|---|---|---|---|---|
| 2025 | $3,190 | $270,421 | $44,630 | $225,791 |
| 2024 | $3,190 | $265,119 | $43,755 | $221,364 |
| 2023 | $3,113 | $259,921 | $42,897 | $217,024 |
| 2022 | $3,073 | $254,825 | $42,056 | $212,769 |
| 2021 | $3,031 | $249,829 | $41,231 | $208,598 |
| 2020 | $3,018 | $247,268 | $40,808 | $206,460 |
| 2019 | $2,937 | $242,420 | $40,008 | $202,412 |
| 2018 | $2,896 | $237,667 | $39,223 | $198,444 |
| 2017 | $2,800 | $233,007 | $38,454 | $194,553 |
| 2016 | $2,774 | $228,439 | $37,700 | $190,739 |
| 2015 | $2,752 | $225,008 | $37,134 | $187,874 |
| 2014 | $2,610 | $220,601 | $36,407 | $184,194 |
Source: Public Records
Map
Nearby Homes
- 5342 Bishop St
- 8762 La Salle St
- 4842 Sapphire Way
- 5475 Twin Lakes Dr
- 9066 Candlestick Ln Unit 5
- 4891 Grace Ave
- 5572 Saint Ann Ave
- 9001 Cerise Ln Unit 109
- 9001 Cerise Ln Unit 113
- 8521 Via Tina
- 5000 Clementine Ln
- 6007 Clementine Ln Unit 21
- 9011 Cerise Ln Unit 129
- 9220 Whitney Way
- 9432 Alderbury St
- 5372 Harvard Way
- 9598 Naples Dr
- 4790 Montefino Dr
- 5201 Del Serra Cir
- 5711 Los Amigos St
- 5215 Lincoln Ave Unit 3
- 5211 Lincoln Ave
- 5217 Lincoln Ave
- 5221 Lincoln Ave Unit 6
- 5223 Lincoln Ave Unit 7
- 5225 Lincoln Ave Unit 8
- 5227 Lincoln Ave
- 5229 Lincoln Ave Unit 10
- 5229 Lincoln Ave
- 5233 Lincoln Ave
- 5235 Lincoln Ave
- 5142 Alaska Ave
- 5162 Alaska Ave
- 5132 Alaska Ave
- 5172 Alaska Ave
- 5122 Alaska Ave
- 5102 Alaska Ave
- 5120 Lincoln Ave
- 5120 Lincoln Ave
- 5092 Alaska Ave
Your Personal Tour Guide
Ask me questions while you tour the home.