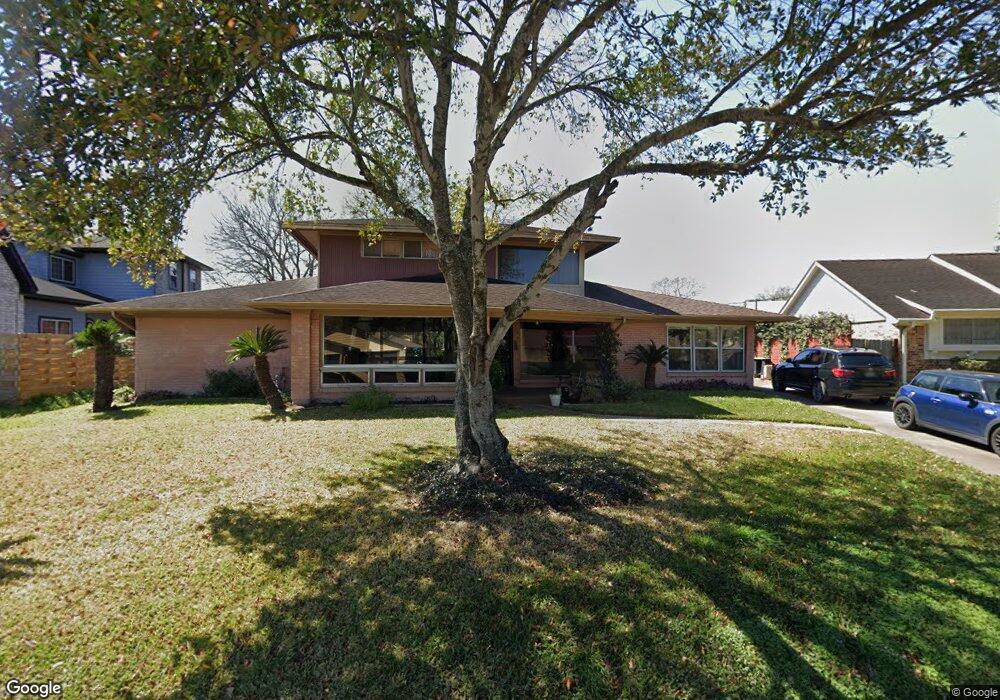
5214 Honey Cir Houston, TX 77004
MacGregor NeighborhoodEstimated Value: $467,000 - $558,527
3
Beds
4
Baths
3,864
Sq Ft
$137/Sq Ft
Est. Value
About This Home
This home is located at 5214 Honey Cir, Houston, TX 77004 and is currently estimated at $528,882, approximately $136 per square foot. 5214 Honey Cir is a home located in Harris County with nearby schools including Lockhart Elementary School, Cullen Middle School, and Yates High School.
Ownership History
Date
Name
Owned For
Owner Type
Purchase Details
Closed on
Jan 8, 2015
Sold by
Onewest Bank Na
Bought by
Steward Christopher L
Current Estimated Value
Home Financials for this Owner
Home Financials are based on the most recent Mortgage that was taken out on this home.
Original Mortgage
$273,600
Outstanding Balance
$209,952
Interest Rate
3.89%
Mortgage Type
New Conventional
Estimated Equity
$318,930
Purchase Details
Closed on
Aug 13, 2014
Sold by
Dasigenis Sandy
Bought by
Onewest Bank Na
Purchase Details
Closed on
Oct 26, 2001
Sold by
Jacquet Calvin
Bought by
Jacquet Thelma
Home Financials for this Owner
Home Financials are based on the most recent Mortgage that was taken out on this home.
Original Mortgage
$164,650
Interest Rate
6.77%
Mortgage Type
Reverse Mortgage Home Equity Conversion Mortgage
Create a Home Valuation Report for This Property
The Home Valuation Report is an in-depth analysis detailing your home's value as well as a comparison with similar homes in the area
Home Values in the Area
Average Home Value in this Area
Purchase History
| Date | Buyer | Sale Price | Title Company |
|---|---|---|---|
| Steward Christopher L | -- | Servicelink | |
| Onewest Bank Na | -- | -- | |
| Onewest Bank Na | -- | -- | |
| Jacquet Thelma | -- | Chicago Title Insurance Co |
Source: Public Records
Mortgage History
| Date | Status | Borrower | Loan Amount |
|---|---|---|---|
| Open | Steward Christopher L | $273,600 | |
| Previous Owner | Jacquet Thelma | $164,650 |
Source: Public Records
Tax History Compared to Growth
Tax History
| Year | Tax Paid | Tax Assessment Tax Assessment Total Assessment is a certain percentage of the fair market value that is determined by local assessors to be the total taxable value of land and additions on the property. | Land | Improvement |
|---|---|---|---|---|
| 2025 | $5,524 | $536,867 | $96,120 | $440,747 |
| 2024 | $5,524 | $494,418 | $96,120 | $398,298 |
| 2023 | $5,524 | $460,136 | $96,120 | $364,016 |
| 2022 | $5,150 | $428,698 | $96,120 | $332,578 |
| 2021 | $7,202 | $401,447 | $93,236 | $308,211 |
| 2020 | $6,605 | $317,826 | $60,876 | $256,950 |
| 2019 | $6,262 | $236,716 | $59,594 | $177,122 |
| 2018 | $4,514 | $236,716 | $64,080 | $172,636 |
| 2017 | $6,258 | $236,716 | $64,080 | $172,636 |
| 2016 | $6,258 | $236,716 | $64,080 | $172,636 |
| 2015 | $1,078 | $236,716 | $64,080 | $172,636 |
| 2014 | $1,078 | $214,381 | $64,080 | $150,301 |
Source: Public Records
Map
Nearby Homes
- 3862 Wichita St
- 0 S Macgregor Way Unit 94380145
- 3834 Rosedale St
- 0 Southmore Blvd
- 3853 Rosedale St
- 3858 Arbor St
- 3854 Arbor St
- 5108 Scott St
- 5121 Grantwood St
- 5114 Grantwood St
- 4031 Fernwood Dr
- 4211 Charleston St
- 4302 Fernwood Dr
- 4315 Fernwood Dr
- 3827 Julius Ln
- 4107 Charleston St
- 4310 Fernwood Dr
- 3729 Rio Vista St
- 3546 Rosedale St
- 4327 Alconbury Ln
- 3939 N Macgregor Way
- 5210 Honey Cir
- 5207 Honey Cir
- 5215 Honey Cir
- 3906 Southmore Cir
- 3870 Gertin St
- 3866 Gertin St
- 3862 Gertin St
- 3910 Southmore Cir
- 3903 Southmore Cir
- 3858 Southmore Blvd
- 3858 Gertin St
- 3907 Southmore Cir
- 3914 Southmore Cir
- 3852 Southmore Blvd
- 3847 N Macgregor Way
- 3865 Gertin St
- 3861 Gertin St
- 3869 Gertin St
- 3911 Southmore Cir