5214 Jefferson Square Oxnard, CA 93033
Cypress NeighborhoodEstimated Value: $387,000 - $434,000
2
Beds
1
Bath
902
Sq Ft
$460/Sq Ft
Est. Value
About This Home
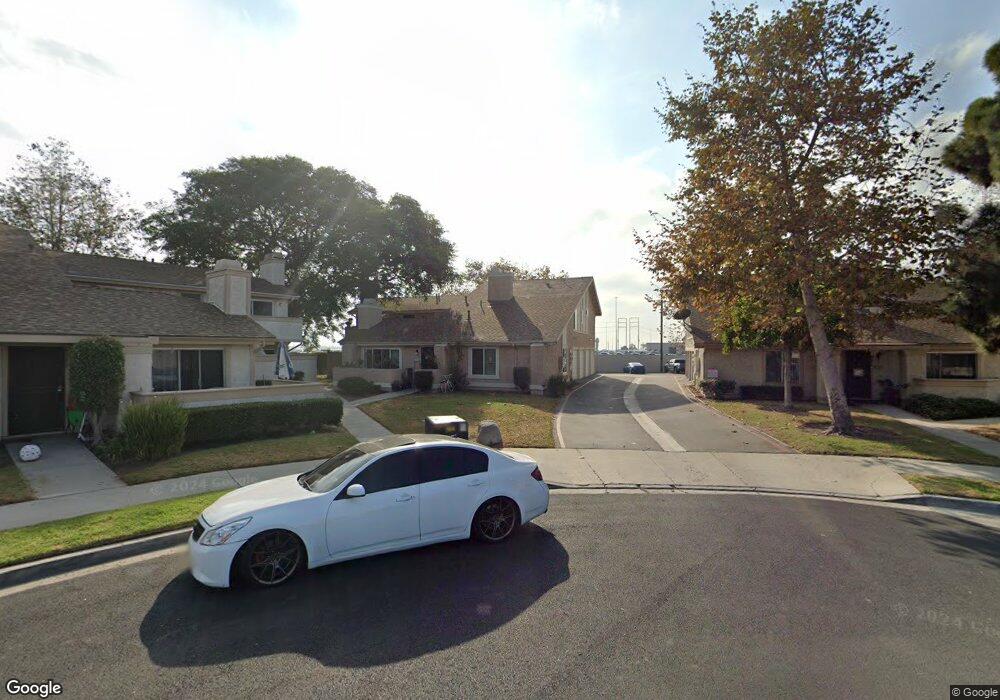
This home is located at 5214 Jefferson Square, Oxnard, CA 93033 and is currently estimated at $415,101, approximately $460 per square foot. 5214 Jefferson Square is a home located in Ventura County with nearby schools including Channel Islands High School.
Ownership History
Date
Name
Owned For
Owner Type
Purchase Details
Closed on
Dec 13, 2007
Sold by
Rollins Robert E
Bought by
Rollins Robert E
Current Estimated Value
Create a Home Valuation Report for This Property
The Home Valuation Report is an in-depth analysis detailing your home's value as well as a comparison with similar homes in the area
Home Values in the Area
Average Home Value in this Area
Purchase History
| Date | Buyer | Sale Price | Title Company |
|---|---|---|---|
| Rollins Robert E | -- | None Available |
Source: Public Records
Tax History
| Year | Tax Paid | Tax Assessment Tax Assessment Total Assessment is a certain percentage of the fair market value that is determined by local assessors to be the total taxable value of land and additions on the property. | Land | Improvement |
|---|---|---|---|---|
| 2025 | $2,117 | $194,428 | $77,770 | $116,658 |
| 2024 | $2,117 | $190,616 | $76,245 | $114,371 |
| 2023 | $2,151 | $186,879 | $74,750 | $112,129 |
| 2022 | $2,022 | $183,215 | $73,284 | $109,931 |
| 2021 | $2,020 | $179,623 | $71,847 | $107,776 |
| 2020 | $2,076 | $177,783 | $71,111 | $106,672 |
| 2019 | $1,996 | $174,298 | $69,717 | $104,581 |
| 2018 | $1,969 | $170,881 | $68,350 | $102,531 |
| 2017 | $1,917 | $167,531 | $67,010 | $100,521 |
| 2016 | $1,828 | $164,247 | $65,697 | $98,550 |
| 2015 | $1,560 | $137,000 | $54,000 | $83,000 |
| 2014 | $1,312 | $116,000 | $46,000 | $70,000 |
Source: Public Records
Map
Nearby Homes
- 5222 Longfellow Way
- 5117 Jefferson Square
- 4910 Justin Way
- 4710 Clover Dr
- 4731 Hamilton Ave
- 5225 Columbus Place
- 5302 Barrymore Dr
- 4614 Concord Way
- 4340 Highland Ave
- 341 Cuesta Del Mar Dr
- 4160 Petit Dr Unit 39
- 320 Columbia Place Unit 46
- 4200 S A St
- 4200 Browning Dr
- 5121 Perkins Rd
- 360 Ibsen Place Unit 129
- 5340 S J St
- 165 Courtyard Dr Unit 26
- 3631 La Costa Place
- 2021 E Bard Rd
- 5216 Jefferson Square
- 5210 Jefferson Square
- 5224 Jefferson Square Unit 40
- 5224 Jefferson Square
- 5220 Jefferson Square
- 5202 Jefferson Square
- 5226 Jefferson Square
- 5222 Jefferson Square
- 5204 Jefferson Square
- 5200 Jefferson Square Unit 29
- 5206 Jefferson Square
- 5221 Jefferson Square
- 5223 Jefferson Square
- 5227 Jefferson Square
- 5225 Jefferson Square
- 5166 Jefferson Square
- 5162 Jefferson Square Unit 25
- 5162 Jefferson Square
- 5164 Jefferson Square
- 5211 Jefferson Square
Your Personal Tour Guide
Ask me questions while you tour the home.