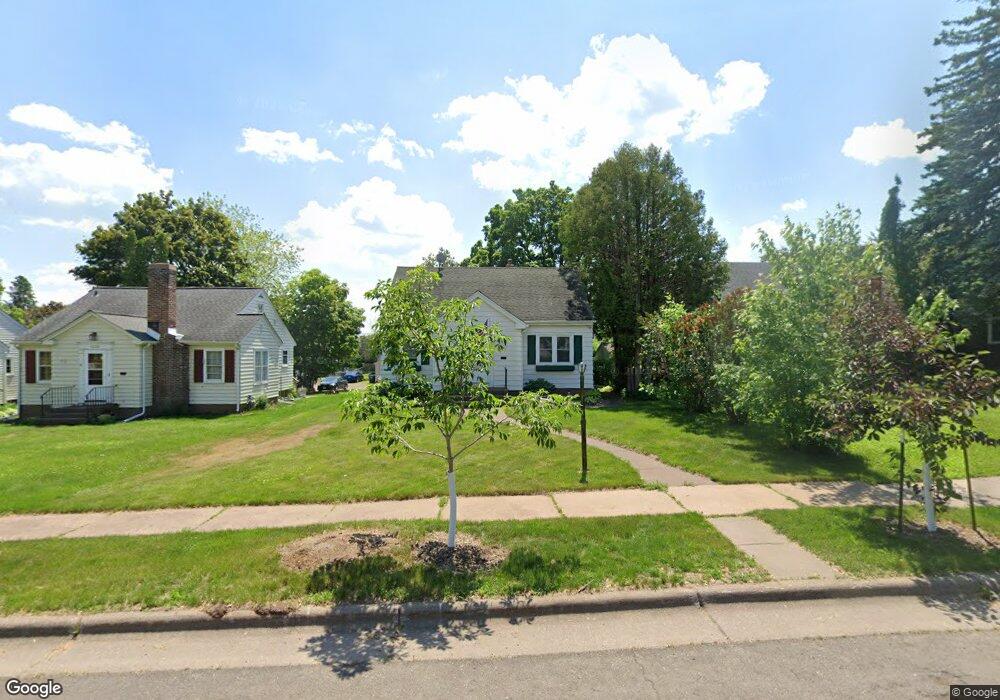
5214 Otsego St Duluth, MN 55804
Lakeside-Lester Park NeighborhoodEstimated Value: $337,000 - $362,000
4
Beds
3
Baths
1,541
Sq Ft
$225/Sq Ft
Est. Value
About This Home
This home is located at 5214 Otsego St, Duluth, MN 55804 and is currently estimated at $346,688, approximately $224 per square foot. 5214 Otsego St is a home located in St. Louis County with nearby schools including Lester Park Elementary School, Ordean East Middle School, and East High School.
Ownership History
Date
Name
Owned For
Owner Type
Purchase Details
Closed on
May 22, 2013
Sold by
Brekken Mandy J and Mestelle Mandy J
Bought by
Brekken Joel A
Current Estimated Value
Purchase Details
Closed on
Mar 23, 2011
Sold by
Brekken Mandy and Brekken Mandy J
Bought by
Brekken Joel A
Purchase Details
Closed on
Oct 1, 2004
Sold by
Rechichi Anthony J
Bought by
Brekken Joel A
Home Financials for this Owner
Home Financials are based on the most recent Mortgage that was taken out on this home.
Original Mortgage
$114,800
Interest Rate
4.06%
Mortgage Type
Purchase Money Mortgage
Purchase Details
Closed on
Dec 18, 2003
Sold by
Comstock Christine Harriette and Rechichi Christine Harriette
Bought by
Rechichi Anthony Joseph
Home Financials for this Owner
Home Financials are based on the most recent Mortgage that was taken out on this home.
Original Mortgage
$120,000
Interest Rate
6.9%
Mortgage Type
Purchase Money Mortgage
Create a Home Valuation Report for This Property
The Home Valuation Report is an in-depth analysis detailing your home's value as well as a comparison with similar homes in the area
Home Values in the Area
Average Home Value in this Area
Purchase History
| Date | Buyer | Sale Price | Title Company |
|---|---|---|---|
| Brekken Joel A | -- | None Available | |
| Brekken Joel A | -- | Lakeview | |
| Brekken Joel A | -- | Lakeview | |
| Brekken Joel A | $143,500 | Scenic Title | |
| Rechichi Anthony Joseph | -- | Slctc |
Source: Public Records
Mortgage History
| Date | Status | Borrower | Loan Amount |
|---|---|---|---|
| Previous Owner | Brekken Joel A | $114,800 | |
| Previous Owner | Rechichi Anthony Joseph | $120,000 | |
| Closed | Brekken Joel A | $14,350 |
Source: Public Records
Tax History Compared to Growth
Tax History
| Year | Tax Paid | Tax Assessment Tax Assessment Total Assessment is a certain percentage of the fair market value that is determined by local assessors to be the total taxable value of land and additions on the property. | Land | Improvement |
|---|---|---|---|---|
| 2024 | $3,868 | $298,900 | $46,200 | $252,700 |
| 2023 | $3,868 | $293,500 | $38,300 | $255,200 |
| 2022 | $4,022 | $269,600 | $35,500 | $234,100 |
| 2021 | $3,364 | $222,900 | $29,400 | $193,500 |
| 2020 | $3,280 | $222,900 | $29,400 | $193,500 |
| 2019 | $2,626 | $212,800 | $28,000 | $184,800 |
| 2018 | $2,284 | $177,200 | $28,000 | $149,200 |
| 2017 | $2,060 | $167,300 | $28,000 | $139,300 |
| 2016 | $2,012 | $147,600 | $28,000 | $119,600 |
| 2015 | $2,085 | $132,600 | $21,500 | $111,100 |
| 2014 | $2,085 | $132,600 | $21,500 | $111,100 |
Source: Public Records
Map
Nearby Homes
- 5209 Colorado St
- 5007 Colorado St
- 5118 Wyoming St
- 5732 E Superior St
- 5220 London Rd
- 5825 E Superior St
- 4931 Wyoming St
- 4814 Peabody St
- 6002 Tioga St
- 4816 Dodge St
- 5918 London Rd
- 5003 London Rd
- 4855 Glendale St
- 4715 Cooke St
- 4520 Oakley St
- 4710 Mcculloch St
- 4320 Oneida St
- 4320 Glenwood St
- 4301 Oneida St
- 4217 Peabody St