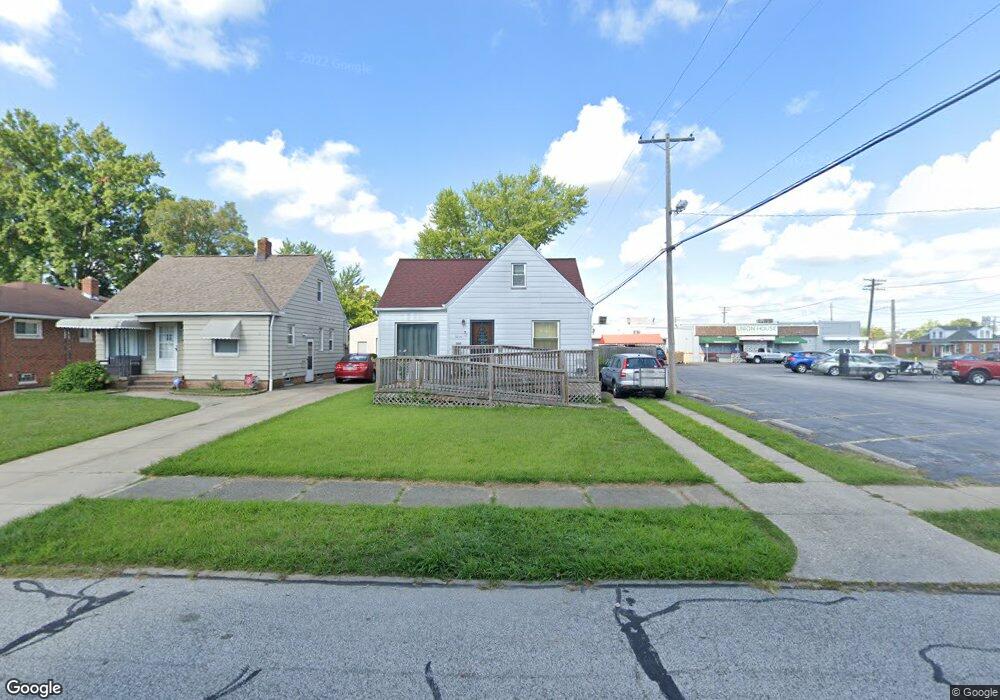
5214 W 26th St Cleveland, OH 44134
Estimated Value: $165,089 - $225,000
4
Beds
1
Bath
1,200
Sq Ft
$161/Sq Ft
Est. Value
About This Home
This home is located at 5214 W 26th St, Cleveland, OH 44134 and is currently estimated at $193,272, approximately $161 per square foot. 5214 W 26th St is a home located in Cuyahoga County with nearby schools including John Muir Elementary School, Shiloh Middle School, and Parma High School.
Ownership History
Date
Name
Owned For
Owner Type
Purchase Details
Closed on
Oct 31, 1997
Sold by
Tirak Vladimir
Bought by
Dunmire Dale A
Current Estimated Value
Home Financials for this Owner
Home Financials are based on the most recent Mortgage that was taken out on this home.
Original Mortgage
$89,850
Outstanding Balance
$15,046
Interest Rate
7.51%
Mortgage Type
New Conventional
Estimated Equity
$178,226
Purchase Details
Closed on
Jun 4, 1993
Sold by
Koly William
Bought by
Tirak Vladimir
Purchase Details
Closed on
May 28, 1993
Sold by
Koly William and Ewis Agnes
Bought by
Koly William
Purchase Details
Closed on
Apr 2, 1991
Sold by
Koly William
Bought by
Koly William and Ewis Agnes
Purchase Details
Closed on
Oct 19, 1987
Sold by
Dykes Stanley L
Bought by
Koly William
Purchase Details
Closed on
Jan 16, 1981
Sold by
Lewis Agnes
Bought by
Dykes Stanley L
Purchase Details
Closed on
Jan 1, 1975
Bought by
Lewis Agnes
Create a Home Valuation Report for This Property
The Home Valuation Report is an in-depth analysis detailing your home's value as well as a comparison with similar homes in the area
Home Values in the Area
Average Home Value in this Area
Purchase History
| Date | Buyer | Sale Price | Title Company |
|---|---|---|---|
| Dunmire Dale A | $89,900 | -- | |
| Tirak Vladimir | $56,000 | -- | |
| Koly William | -- | -- | |
| Koly William | -- | -- | |
| Koly William | $42,500 | -- | |
| Dykes Stanley L | $11,000 | -- | |
| Lewis Agnes | -- | -- |
Source: Public Records
Mortgage History
| Date | Status | Borrower | Loan Amount |
|---|---|---|---|
| Open | Dunmire Dale A | $89,850 |
Source: Public Records
Tax History Compared to Growth
Tax History
| Year | Tax Paid | Tax Assessment Tax Assessment Total Assessment is a certain percentage of the fair market value that is determined by local assessors to be the total taxable value of land and additions on the property. | Land | Improvement |
|---|---|---|---|---|
| 2024 | $2,345 | $46,270 | $10,080 | $36,190 |
| 2023 | $2,194 | $38,710 | $8,330 | $30,380 |
| 2022 | $2,198 | $38,710 | $8,330 | $30,380 |
| 2021 | $2,257 | $38,710 | $8,330 | $30,380 |
| 2020 | $1,838 | $29,790 | $6,410 | $23,380 |
| 2019 | $2,428 | $85,100 | $18,300 | $66,800 |
| 2018 | $2,291 | $29,790 | $6,410 | $23,380 |
| 2017 | $2,301 | $26,110 | $4,760 | $21,350 |
| 2016 | $2,288 | $26,110 | $4,760 | $21,350 |
| 2015 | $2,175 | $26,110 | $4,760 | $21,350 |
| 2014 | $2,175 | $26,640 | $4,870 | $21,770 |
Source: Public Records
Map
Nearby Homes
- 2923 Brookview Blvd
- 3000 Brookpark Rd Unit R10
- 2804 Russell Ave
- 2831 Walbrook Ave
- 2301 Tuxedo Ave
- 2129 North Ave
- 3323 North Ave
- 3402 North Ave
- 2712 Ralph Ave
- 3302 Grovewood Ave
- 2302 Brookdale Ave
- 4781 W 32nd St
- 2923 Brookdale Ave
- 2506 Fortune Ave
- 2446 Fortune Ave
- 3107 Brookdale Ave
- 3707 Freehold Ave
- 3706 Woodway Ave
- 1716 Tuxedo Ave
- 3807 Freehold Ave
- 5218 W 26th St
- 5222 W 26th St
- 5226 W 26th St
- 5217 W 28th St
- 5230 W 26th St
- 5221 W 28th St
- 5225 W 28th St
- 5213 W 26th St
- 5217 W 26th St
- 5229 W 28th St
- 5227 W 26th St
- 2713 Brookpark Rd
- 2525 Brookpark Rd
- 2618 Brookview Blvd
- 2610 Brookview Blvd
- 2702 Brookview Blvd
- 5229 W 26th St
- 2706 Brookview Blvd
- 2714 Brookview Blvd
- 2530 Brookview Blvd