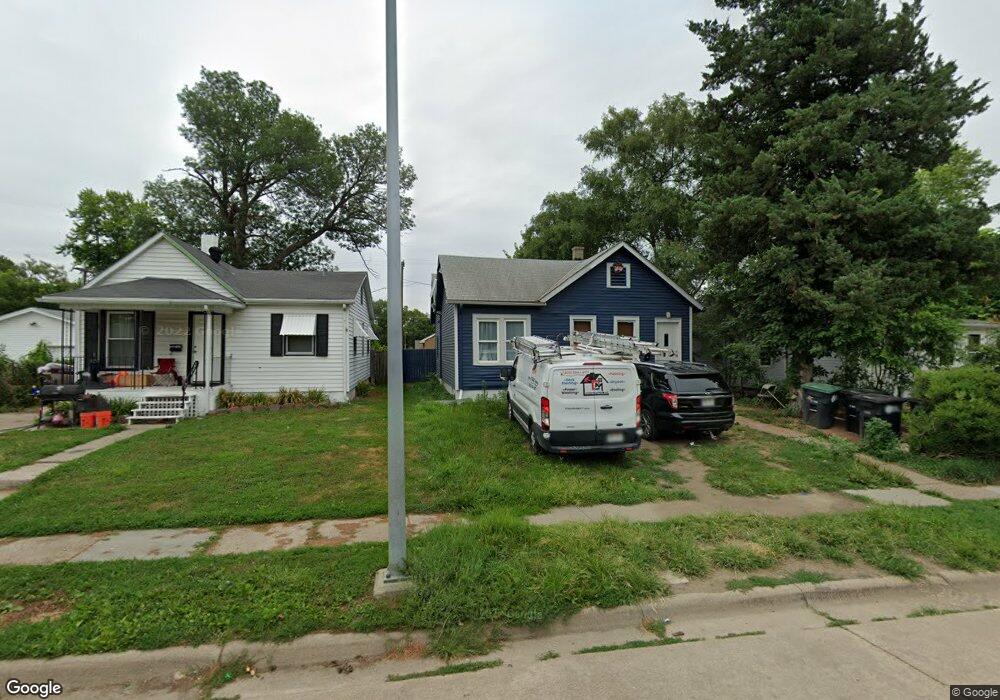
5215 N 14th St Omaha, NE 68110
Sherman NeighborhoodEstimated Value: $133,078 - $165,000
3
Beds
3
Baths
1,231
Sq Ft
$126/Sq Ft
Est. Value
About This Home
This home is located at 5215 N 14th St, Omaha, NE 68110 and is currently estimated at $154,770, approximately $125 per square foot. 5215 N 14th St is a home located in Douglas County with nearby schools including Sherman Elementary School, McMillan Middle School, and North High School.
Ownership History
Date
Name
Owned For
Owner Type
Purchase Details
Closed on
Feb 9, 2018
Bought by
Valdivieso Cesar E
Current Estimated Value
Purchase Details
Closed on
Aug 7, 2017
Sold by
Omaha Municipal Land Bank
Purchase Details
Closed on
Apr 24, 2017
Sold by
Wells Fargo Bank Na
Bought by
Oamaha Mucipal Land Bank
Purchase Details
Closed on
Feb 21, 2017
Sold by
Bank Of America Na
Bought by
Wells Fargo Bank Na
Purchase Details
Closed on
Feb 17, 2017
Sold by
Federal National Mortgage Association
Bought by
Bank Of America N A
Purchase Details
Closed on
Dec 7, 2016
Sold by
Secretary Of Hud
Bought by
Federal National Mortgage Association
Purchase Details
Closed on
Jul 18, 2014
Sold by
Federal Naitonal Mortgage Association
Bought by
Secretary Of Hud
Purchase Details
Closed on
Sep 9, 2013
Sold by
Lemp Eric Tr
Bought by
Federal National Mortgage Association
Create a Home Valuation Report for This Property
The Home Valuation Report is an in-depth analysis detailing your home's value as well as a comparison with similar homes in the area
Home Values in the Area
Average Home Value in this Area
Purchase History
| Date | Buyer | Sale Price | Title Company |
|---|---|---|---|
| Valdivieso Cesar E | $20,000 | Charter Title & Escrow Svcs | |
| -- | $10,000 | None Available | |
| Oamaha Mucipal Land Bank | $29,000 | None Available | |
| Wells Fargo Bank Na | $10,000 | None Available | |
| Bank Of America N A | -- | None Available | |
| Federal National Mortgage Association | -- | None Available | |
| Secretary Of Hud | -- | None Available | |
| Federal National Mortgage Association | $34,000 | -- |
Source: Public Records
Tax History
| Year | Tax Paid | Tax Assessment Tax Assessment Total Assessment is a certain percentage of the fair market value that is determined by local assessors to be the total taxable value of land and additions on the property. | Land | Improvement |
|---|---|---|---|---|
| 2025 | $1,828 | $110,200 | $6,500 | $103,700 |
| 2024 | $2,000 | $110,200 | $6,500 | $103,700 |
| 2023 | $2,000 | $94,800 | $6,500 | $88,300 |
| 2022 | $1,552 | $72,700 | $6,500 | $66,200 |
| 2021 | $955 | $45,100 | $6,500 | $38,600 |
| 2020 | $966 | $45,100 | $6,500 | $38,600 |
| 2019 | $479 | $22,300 | $700 | $21,600 |
| 2018 | $198 | $9,200 | $700 | $8,500 |
| 2017 | $199 | $9,200 | $700 | $8,500 |
| 2016 | $609 | $28,400 | $600 | $27,800 |
Source: Public Records
Map
Nearby Homes
- 5104 N 14th St
- 1415 Browne St
- 4704 N 14th Ave
- 5326 N 8th St
- 5702 N 16th St Unit 73
- 5702 N 16th St Unit 57
- 4554 N 16th St
- 4726 N 18th St
- 650 Jaynes St
- 2038 Fowler Ave
- 111 Shoreline Dr
- 4416 N 21st St
- 1716 Sprague St
- 5124 N 2nd St
- 2434 Camden Ave
- 6012 Florence Blvd
- 2524 Fort St
- 5900 N 24th St
- 2420 Ames Ave
- 2504 Hartman Ave
Your Personal Tour Guide
Ask me questions while you tour the home.