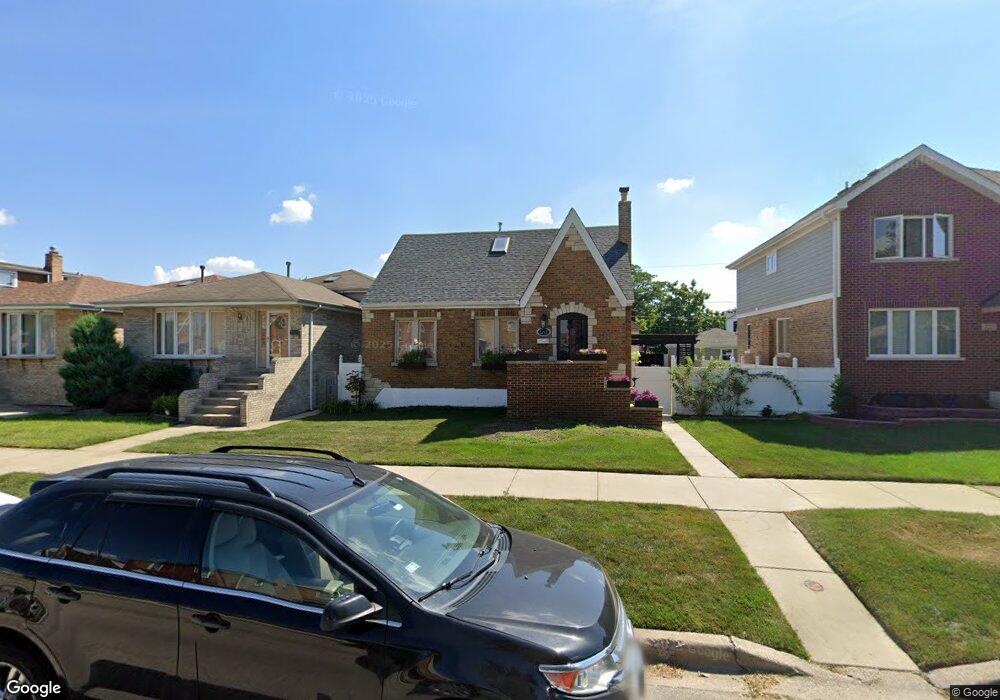
5215 S Moody Ave Chicago, IL 60638
Garfield Ridge NeighborhoodEstimated Value: $405,000 - $538,000
3
Beds
2
Baths
2,236
Sq Ft
$211/Sq Ft
Est. Value
About This Home
This home is located at 5215 S Moody Ave, Chicago, IL 60638 and is currently estimated at $472,212, approximately $211 per square foot. 5215 S Moody Ave is a home located in Cook County with nearby schools including Byrne Elementary School, Kennedy High School, and Gloria Dei Lutheran School.
Ownership History
Date
Name
Owned For
Owner Type
Purchase Details
Closed on
Jan 18, 2012
Sold by
Deutsche Bank National Trust Company
Bought by
Garcia Veronica L
Current Estimated Value
Home Financials for this Owner
Home Financials are based on the most recent Mortgage that was taken out on this home.
Original Mortgage
$123,780
Interest Rate
3.75%
Mortgage Type
FHA
Purchase Details
Closed on
Nov 4, 2010
Sold by
Mendoza Lisa
Bought by
Deutsche Bank National Trust Company
Purchase Details
Closed on
Nov 19, 2005
Sold by
Legut Margaret M
Bought by
Mendoza Lisa
Home Financials for this Owner
Home Financials are based on the most recent Mortgage that was taken out on this home.
Original Mortgage
$196,000
Interest Rate
7.99%
Mortgage Type
Unknown
Purchase Details
Closed on
Mar 17, 1999
Sold by
Palubin Aldona V
Bought by
Palubin Aldona V and Aldona V Palubin Trust
Create a Home Valuation Report for This Property
The Home Valuation Report is an in-depth analysis detailing your home's value as well as a comparison with similar homes in the area
Home Values in the Area
Average Home Value in this Area
Purchase History
| Date | Buyer | Sale Price | Title Company |
|---|---|---|---|
| Garcia Veronica L | $127,000 | Premier Title | |
| Deutsche Bank National Trust Company | -- | Premier Title | |
| Mendoza Lisa | $245,000 | Atgf Inc | |
| Palubin Aldona V | -- | -- |
Source: Public Records
Mortgage History
| Date | Status | Borrower | Loan Amount |
|---|---|---|---|
| Previous Owner | Garcia Veronica L | $123,780 | |
| Previous Owner | Mendoza Lisa | $196,000 |
Source: Public Records
Tax History Compared to Growth
Tax History
| Year | Tax Paid | Tax Assessment Tax Assessment Total Assessment is a certain percentage of the fair market value that is determined by local assessors to be the total taxable value of land and additions on the property. | Land | Improvement |
|---|---|---|---|---|
| 2024 | $6,509 | $47,000 | $8,750 | $38,250 |
| 2023 | $6,325 | $34,001 | $7,813 | $26,188 |
| 2022 | $6,325 | $34,001 | $7,813 | $26,188 |
| 2021 | $6,167 | $33,999 | $7,812 | $26,187 |
| 2020 | $7,117 | $34,843 | $6,250 | $28,593 |
| 2019 | $7,135 | $38,715 | $6,250 | $32,465 |
| 2018 | $7,014 | $38,715 | $6,250 | $32,465 |
| 2017 | $5,813 | $30,199 | $5,625 | $24,574 |
| 2016 | $5,585 | $30,199 | $5,625 | $24,574 |
| 2015 | $5,090 | $30,199 | $5,625 | $24,574 |
| 2014 | $5,105 | $29,872 | $5,312 | $24,560 |
| 2013 | $4,995 | $29,872 | $5,312 | $24,560 |
Source: Public Records
Map
Nearby Homes
- 5141 S Merrimac Ave
- 5128 S Meade Ave
- 5253 S Mobile Ave
- 5118 S Mobile Ave
- 5417 S Melvina Ave Unit 102
- 5142 S Mulligan Ave
- 5248 S Narragansett Ave
- 5421 S Mulligan Ave
- 6340 S Archer Ave
- 5245 S Mayfield Ave
- 5250 S Nagle Ave
- 5850 W 55th St Unit 3D
- 5621 S Moody Ave
- 5108 S Massasoit Ave
- 5112 S Nashville Ave
- 5533 S Menard Ave
- 5727 S Meade Ave
- 5127 S Parkside Ave
- 5712 W 56th St
- 5700 S Monitor Ave
- 5213 S Moody Ave
- 5221 S Moody Ave
- 5211 S Moody Ave
- 5225 S Moody Ave
- 5209 S Moody Ave
- 5227 S Moody Ave
- 5205 S Moody Ave
- 5222 S Meade Ave
- 5222 S Meade Ave
- 5212 S Meade Ave
- 5212 S Meade Ave
- 5233 S Moody Ave
- 5228 S Meade Ave
- 5208 S Meade Ave
- 5201 S Moody Ave
- 5230 S Meade Ave
- 5206 S Meade Ave
- 5218 S Moody Ave
- 5216 S Moody Ave
- 5220 S Moody Ave