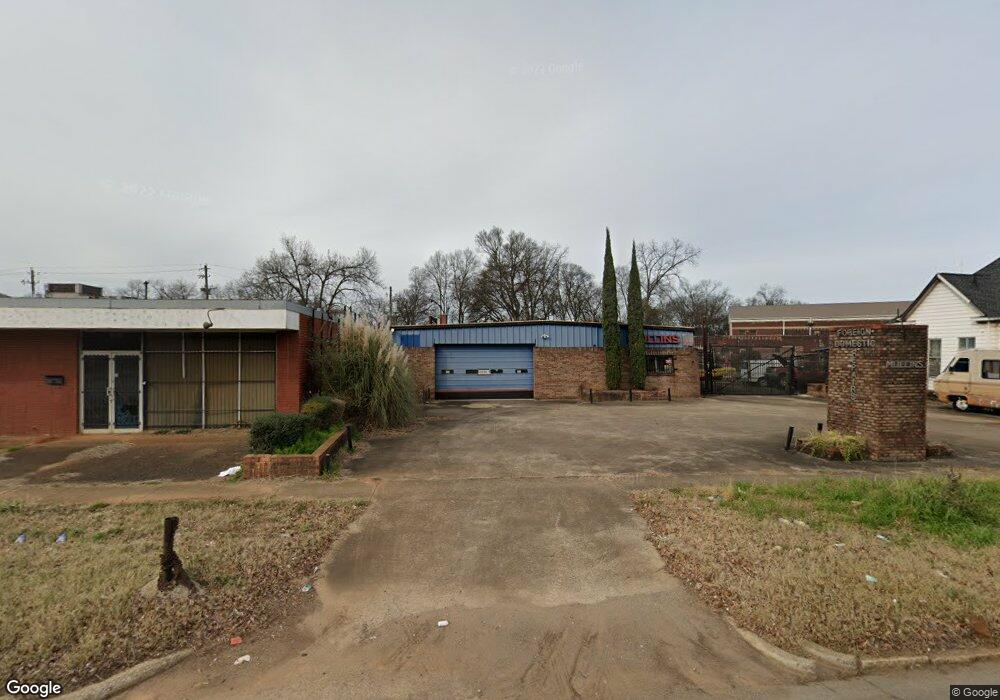
5216 1st Ave N Birmingham, AL 35212
Woodlawn NeighborhoodEstimated Value: $157,287
--
Bed
1
Bath
2,500
Sq Ft
$63/Sq Ft
Est. Value
About This Home
This home is located at 5216 1st Ave N, Birmingham, AL 35212 and is currently estimated at $157,287, approximately $62 per square foot. 5216 1st Ave N is a home located in Jefferson County with nearby schools including C. W. Hayes K-8 School, Woodlawn High School-Magnet, and Cornerstone Schools of Alabama.
Ownership History
Date
Name
Owned For
Owner Type
Purchase Details
Closed on
Apr 3, 2025
Sold by
Mullins Susan Jones
Bought by
Blaising Properties Llc
Current Estimated Value
Home Financials for this Owner
Home Financials are based on the most recent Mortgage that was taken out on this home.
Original Mortgage
$121,342
Outstanding Balance
$97,254
Interest Rate
6.04%
Mortgage Type
Seller Take Back
Estimated Equity
$60,033
Purchase Details
Closed on
Mar 30, 2025
Sold by
Loggins Leslie
Bought by
Blaising Properties Llc
Home Financials for this Owner
Home Financials are based on the most recent Mortgage that was taken out on this home.
Original Mortgage
$121,342
Outstanding Balance
$97,254
Interest Rate
6.04%
Mortgage Type
Seller Take Back
Estimated Equity
$60,033
Purchase Details
Closed on
Mar 26, 2025
Sold by
Loggins Golden April
Bought by
Blaising Properties Llc
Home Financials for this Owner
Home Financials are based on the most recent Mortgage that was taken out on this home.
Original Mortgage
$121,342
Outstanding Balance
$97,254
Interest Rate
6.04%
Mortgage Type
Seller Take Back
Estimated Equity
$60,033
Purchase Details
Closed on
Feb 22, 2025
Sold by
Mullins Malcolm Nancy
Bought by
Blaising Properties Llc
Home Financials for this Owner
Home Financials are based on the most recent Mortgage that was taken out on this home.
Original Mortgage
$121,342
Outstanding Balance
$97,254
Interest Rate
6.04%
Mortgage Type
Seller Take Back
Estimated Equity
$60,033
Purchase Details
Closed on
Feb 17, 2025
Sold by
Mullins Lindell Cynthia
Bought by
Blaising Properties Llc
Home Financials for this Owner
Home Financials are based on the most recent Mortgage that was taken out on this home.
Original Mortgage
$121,342
Outstanding Balance
$97,254
Interest Rate
6.04%
Mortgage Type
Seller Take Back
Estimated Equity
$60,033
Purchase Details
Closed on
Feb 12, 2025
Sold by
Loggins Leslie Michelle
Bought by
Blaising Properties Llc
Home Financials for this Owner
Home Financials are based on the most recent Mortgage that was taken out on this home.
Original Mortgage
$121,342
Outstanding Balance
$97,254
Interest Rate
6.04%
Mortgage Type
Seller Take Back
Estimated Equity
$60,033
Purchase Details
Closed on
Dec 26, 2024
Sold by
Mullins David
Bought by
Blaising Properties Llc
Create a Home Valuation Report for This Property
The Home Valuation Report is an in-depth analysis detailing your home's value as well as a comparison with similar homes in the area
Home Values in the Area
Average Home Value in this Area
Purchase History
| Date | Buyer | Sale Price | Title Company |
|---|---|---|---|
| Blaising Properties Llc | $153,500 | None Listed On Document | |
| Blaising Properties Llc | $123,500 | None Listed On Document | |
| Blaising Properties Llc | $123,500 | None Listed On Document | |
| Blaising Properties Llc | $123,500 | None Listed On Document | |
| Blaising Properties Llc | $123,500 | None Listed On Document | |
| Blaising Properties Llc | -- | Clear Title | |
| Blaising Properties Llc | $123,500 | None Listed On Document | |
| Blaising Properties Llc | $123,500 | None Listed On Document | |
| Blaising Properties Llc | -- | None Listed On Document |
Source: Public Records
Mortgage History
| Date | Status | Borrower | Loan Amount |
|---|---|---|---|
| Open | Blaising Properties Llc | $121,342 |
Source: Public Records
Tax History Compared to Growth
Tax History
| Year | Tax Paid | Tax Assessment Tax Assessment Total Assessment is a certain percentage of the fair market value that is determined by local assessors to be the total taxable value of land and additions on the property. | Land | Improvement |
|---|---|---|---|---|
| 2024 | $2,900 | $40,000 | -- | -- |
| 2022 | $2,274 | $31,360 | $9,000 | $22,360 |
| 2021 | $2,274 | $31,360 | $9,000 | $22,360 |
| 2020 | $2,274 | $31,360 | $9,000 | $22,360 |
| 2019 | $2,274 | $31,360 | $0 | $0 |
| 2018 | $1,749 | $24,120 | $0 | $0 |
| 2017 | $1,749 | $24,120 | $0 | $0 |
| 2016 | $1,749 | $24,120 | $0 | $0 |
| 2015 | $1,749 | $24,120 | $0 | $0 |
| 2014 | $1,786 | $25,700 | $0 | $0 |
| 2013 | $1,786 | $25,700 | $0 | $0 |
Source: Public Records
Map
Nearby Homes