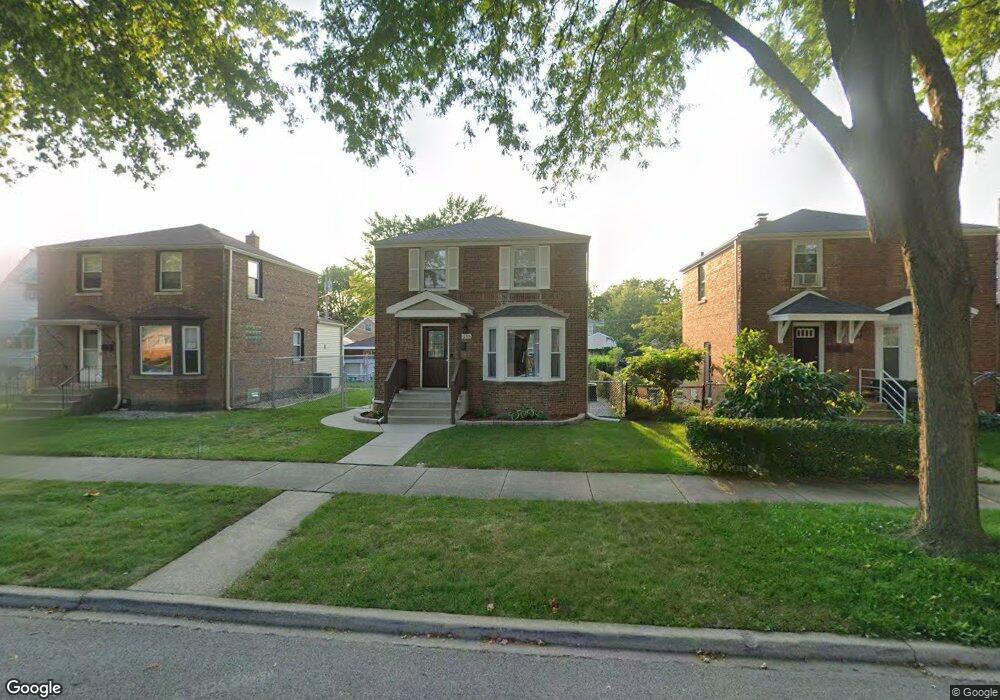
5216 S Natoma Ave Chicago, IL 60638
Garfield Ridge NeighborhoodEstimated Value: $339,000 - $384,000
3
Beds
1
Bath
1,115
Sq Ft
$318/Sq Ft
Est. Value
About This Home
This home is located at 5216 S Natoma Ave, Chicago, IL 60638 and is currently estimated at $355,035, approximately $318 per square foot. 5216 S Natoma Ave is a home located in Cook County with nearby schools including Byrne Elementary School, Kennedy High School, and St Daniel The Prophet School.
Ownership History
Date
Name
Owned For
Owner Type
Purchase Details
Closed on
Nov 22, 2020
Sold by
Ellison Daniel
Bought by
Lenti James E
Current Estimated Value
Home Financials for this Owner
Home Financials are based on the most recent Mortgage that was taken out on this home.
Original Mortgage
$216,000
Interest Rate
2.75%
Mortgage Type
New Conventional
Purchase Details
Closed on
Jan 8, 2016
Sold by
Street Scott W and Street Broke A
Bought by
Ellison Daniel
Home Financials for this Owner
Home Financials are based on the most recent Mortgage that was taken out on this home.
Original Mortgage
$255,375
Interest Rate
4%
Mortgage Type
VA
Purchase Details
Closed on
Aug 11, 2015
Sold by
Chicago Title Land Trust
Bought by
Street Scott W and Street Brooke A
Home Financials for this Owner
Home Financials are based on the most recent Mortgage that was taken out on this home.
Original Mortgage
$96,000
Interest Rate
4.87%
Mortgage Type
New Conventional
Create a Home Valuation Report for This Property
The Home Valuation Report is an in-depth analysis detailing your home's value as well as a comparison with similar homes in the area
Home Values in the Area
Average Home Value in this Area
Purchase History
| Date | Buyer | Sale Price | Title Company |
|---|---|---|---|
| Lenti James E | $270,000 | Chicago Title | |
| Ellison Daniel | $250,000 | Old Republic Title | |
| Street Scott W | $120,000 | Chicago Title Land Trust Co |
Source: Public Records
Mortgage History
| Date | Status | Borrower | Loan Amount |
|---|---|---|---|
| Previous Owner | Lenti James E | $216,000 | |
| Previous Owner | Ellison Daniel | $255,375 | |
| Previous Owner | Street Scott W | $96,000 |
Source: Public Records
Tax History Compared to Growth
Tax History
| Year | Tax Paid | Tax Assessment Tax Assessment Total Assessment is a certain percentage of the fair market value that is determined by local assessors to be the total taxable value of land and additions on the property. | Land | Improvement |
|---|---|---|---|---|
| 2024 | $5,091 | $27,000 | $7,448 | $19,552 |
| 2023 | $4,964 | $24,000 | $6,650 | $17,350 |
| 2022 | $4,964 | $24,000 | $6,650 | $17,350 |
| 2021 | $4,826 | $24,000 | $6,650 | $17,350 |
| 2020 | $4,007 | $20,971 | $5,320 | $15,651 |
| 2019 | $4,018 | $23,302 | $5,320 | $17,982 |
| 2018 | $3,950 | $23,302 | $5,320 | $17,982 |
| 2017 | $2,938 | $16,932 | $4,788 | $12,144 |
| 2016 | $3,414 | $16,932 | $4,788 | $12,144 |
| 2015 | $3,125 | $16,932 | $4,788 | $12,144 |
| 2014 | $2,109 | $16,054 | $4,522 | $11,532 |
| 2013 | $2,117 | $16,054 | $4,522 | $11,532 |
Source: Public Records
Map
Nearby Homes
- 5205 S Nashville Ave
- 5244 S Neenah Ave
- 5112 S Nashville Ave
- 5250 S Nagle Ave
- 5326 S Nagle Ave
- 5246 S New England Ave
- 5209 S Narragansett Ave
- 5445 S Natchez Ave
- 5148 S Newland Ave
- 5522 S Normandy Ave
- 5519 S Nashville Ave
- 5523 S Neenah Ave
- 5118 S Mobile Ave
- 5525 S Nagle Ave
- 5148 S Nordica Ave
- 6340 S Archer Ave
- 5141 S Merrimac Ave
- 5622 S Oak Park Ave
- 5254 S Melvina Ave
- 5653 S Normandy Ave
- 5212 S Natoma Ave
- 5208 S Natoma Ave
- 5222 S Natoma Ave
- 5204 S Natoma Ave
- 5228 S Natoma Ave
- 5219 S Normandy Ave
- 5215 S Normandy Ave
- 5221 S Normandy Ave
- 5211 S Normandy Ave
- 5225 S Normandy Ave
- 5200 S Natoma Ave
- 5209 S Normandy Ave
- 5232 S Natoma Ave
- 5205 S Normandy Ave
- 5217 S Natoma Ave
- 5213 S Natoma Ave
- 5221 S Natoma Ave
- 5236 S Natoma Ave
- 5201 S Normandy Ave
- 5235 S Normandy Ave