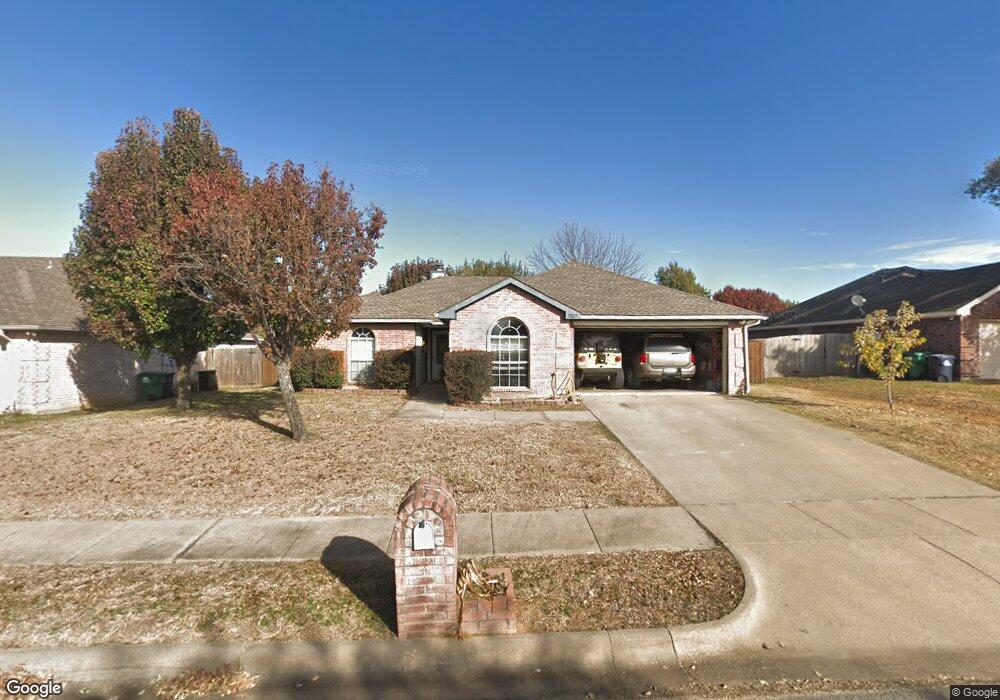
5217 Paulie Dr Denton, TX 76208
Estimated Value: $302,374 - $331,000
3
Beds
2
Baths
1,349
Sq Ft
$236/Sq Ft
Est. Value
About This Home
This home is located at 5217 Paulie Dr, Denton, TX 76208 and is currently estimated at $318,344, approximately $235 per square foot. 5217 Paulie Dr is a home located in Denton County with nearby schools including Rivera Elementary School, Bettye Myers Middle School, and Billy Ryan High School.
Ownership History
Date
Name
Owned For
Owner Type
Purchase Details
Closed on
May 25, 2018
Sold by
Lone Oak 166 Llc
Bought by
Estrada Aureliano J and Estrada Yolanda
Current Estimated Value
Purchase Details
Closed on
Dec 17, 2004
Sold by
Baker Darrell W and Baker Jennifer A
Bought by
Estrada Aureliano and Estrada Yolanda
Home Financials for this Owner
Home Financials are based on the most recent Mortgage that was taken out on this home.
Original Mortgage
$114,000
Interest Rate
9%
Mortgage Type
Purchase Money Mortgage
Purchase Details
Closed on
Mar 27, 2000
Sold by
Woodhaven Partners Ltd
Bought by
Baker Darrell W and Baker Jennifer A
Home Financials for this Owner
Home Financials are based on the most recent Mortgage that was taken out on this home.
Original Mortgage
$104,704
Interest Rate
8.33%
Mortgage Type
FHA
Create a Home Valuation Report for This Property
The Home Valuation Report is an in-depth analysis detailing your home's value as well as a comparison with similar homes in the area
Home Values in the Area
Average Home Value in this Area
Purchase History
| Date | Buyer | Sale Price | Title Company |
|---|---|---|---|
| Estrada Aureliano J | -- | Title Resources | |
| Estrada Aureliano | -- | Reunion Title | |
| Baker Darrell W | -- | -- |
Source: Public Records
Mortgage History
| Date | Status | Borrower | Loan Amount |
|---|---|---|---|
| Previous Owner | Estrada Aureliano | $114,000 | |
| Previous Owner | Baker Darrell W | $104,704 |
Source: Public Records
Tax History Compared to Growth
Tax History
| Year | Tax Paid | Tax Assessment Tax Assessment Total Assessment is a certain percentage of the fair market value that is determined by local assessors to be the total taxable value of land and additions on the property. | Land | Improvement |
|---|---|---|---|---|
| 2025 | $4,038 | $298,257 | $71,592 | $227,834 |
| 2024 | $5,234 | $271,143 | $0 | $0 |
| 2023 | $3,510 | $246,494 | $71,592 | $223,284 |
| 2022 | $4,757 | $224,085 | $71,592 | $188,865 |
| 2021 | $4,529 | $203,714 | $45,216 | $158,498 |
| 2020 | $4,262 | $186,441 | $45,216 | $141,225 |
| 2019 | $4,368 | $183,060 | $45,216 | $142,813 |
| 2018 | $4,020 | $166,418 | $45,216 | $131,418 |
| 2017 | $3,739 | $151,289 | $45,216 | $115,752 |
| 2016 | $3,238 | $137,535 | $33,912 | $105,100 |
| 2015 | $2,578 | $125,032 | $33,912 | $101,404 |
| 2013 | -- | $114,661 | $29,616 | $85,045 |
Source: Public Records
Map
Nearby Homes
- 912 Cole Ave
- 5090 E Mckinney St
- 5130 E Mckinney St
- Masterpiece Plan at The Reserve on McKinney
- Super Saver Plan at The Reserve on McKinney
- Valu Premier Plan at The Reserve on McKinney
- Pure Plan at The Reserve on McKinney
- Anthem Plan at The Reserve on McKinney
- Fiesta Plan at The Reserve on McKinney
- El Rancho Plan at The Reserve on McKinney
- Americana Plan at The Reserve on McKinney
- Keystone Plan at The Reserve on McKinney
- Landmark Plan at The Reserve on McKinney
- 1309 Bridges St
- 0000 Cove Dr
- Rayburn Plan at Townsend Green
- Stockdale Plan at Townsend Green
- Thomaston Plan at Townsend Green
- Eastgate Plan at Townsend Green
- Morgan Plan at Townsend Green
- 5213 Paulie Dr
- 5221 Paulie Dr
- 5212 Whiting Way
- 5220 Whiting Way
- 5209 Paulie Dr
- 5220 Paulie Dr
- 5216 Paulie Dr
- 5208 Whiting Way
- 5224 Paulie Dr
- 5212 Paulie Dr
- 5301 Paulie Dr
- 5205 Paulie Dr
- 5300 Whiting Way
- 5208 Paulie Dr
- 5204 Whiting Way
- 5217 Whiting Way
- 5300 Paulie Dr
- 5213 Whiting Way
- 5221 Whiting Way
- 5221 Abby Way