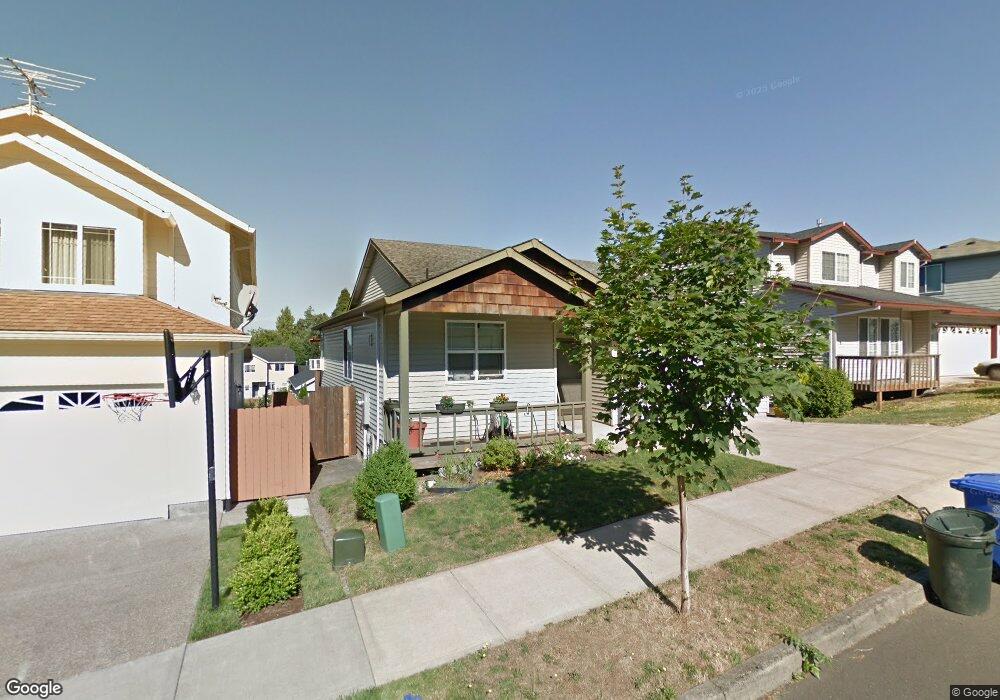
5217 SE 140th Place Portland, OR 97236
Powellhurst-Gilbert NeighborhoodEstimated Value: $438,000 - $444,000
3
Beds
2
Baths
1,512
Sq Ft
$292/Sq Ft
Est. Value
About This Home
This home is located at 5217 SE 140th Place, Portland, OR 97236 and is currently estimated at $441,478, approximately $291 per square foot. 5217 SE 140th Place is a home located in Multnomah County with nearby schools including Gilbert Heights Elementary School, Alice Ott Middle School, and David Douglas High School.
Ownership History
Date
Name
Owned For
Owner Type
Purchase Details
Closed on
Aug 10, 2009
Sold by
Tran Kinh T
Bought by
Riddle William E and Riddle Jeanine P
Current Estimated Value
Home Financials for this Owner
Home Financials are based on the most recent Mortgage that was taken out on this home.
Original Mortgage
$216,015
Outstanding Balance
$141,988
Interest Rate
5.37%
Mortgage Type
FHA
Estimated Equity
$299,490
Purchase Details
Closed on
Mar 4, 2002
Sold by
Flikkema Homes Inc
Bought by
Tran Kinh T and Nguyen Ninh Ngoc
Home Financials for this Owner
Home Financials are based on the most recent Mortgage that was taken out on this home.
Original Mortgage
$112,000
Interest Rate
6.94%
Mortgage Type
Purchase Money Mortgage
Purchase Details
Closed on
Oct 30, 2001
Sold by
M A D W Development Llc
Bought by
Flikkema Homes Inc
Home Financials for this Owner
Home Financials are based on the most recent Mortgage that was taken out on this home.
Original Mortgage
$135,200
Interest Rate
6.84%
Mortgage Type
Credit Line Revolving
Create a Home Valuation Report for This Property
The Home Valuation Report is an in-depth analysis detailing your home's value as well as a comparison with similar homes in the area
Home Values in the Area
Average Home Value in this Area
Purchase History
| Date | Buyer | Sale Price | Title Company |
|---|---|---|---|
| Riddle William E | $220,000 | Pacific Nw Title Of Or Inc | |
| Tran Kinh T | $165,950 | Chicago Title | |
| Flikkema Homes Inc | $52,700 | Chicago Title Insurance Co |
Source: Public Records
Mortgage History
| Date | Status | Borrower | Loan Amount |
|---|---|---|---|
| Open | Riddle William E | $216,015 | |
| Previous Owner | Tran Kinh T | $112,000 | |
| Previous Owner | Flikkema Homes Inc | $135,200 |
Source: Public Records
Tax History Compared to Growth
Tax History
| Year | Tax Paid | Tax Assessment Tax Assessment Total Assessment is a certain percentage of the fair market value that is determined by local assessors to be the total taxable value of land and additions on the property. | Land | Improvement |
|---|---|---|---|---|
| 2024 | $5,351 | $224,290 | -- | -- |
| 2023 | $5,118 | $217,760 | $0 | $0 |
| 2022 | $4,851 | $211,420 | $0 | $0 |
| 2021 | $4,772 | $205,270 | $0 | $0 |
| 2020 | $4,323 | $199,300 | $0 | $0 |
| 2019 | $4,185 | $193,500 | $0 | $0 |
| 2018 | $4,057 | $187,870 | $0 | $0 |
| 2017 | $3,787 | $182,400 | $0 | $0 |
| 2016 | $3,631 | $177,090 | $0 | $0 |
| 2015 | $3,288 | $171,940 | $0 | $0 |
| 2014 | $2,916 | $166,940 | $0 | $0 |
Source: Public Records
Map
Nearby Homes
- 14139 SE Insley St
- 5569 SE 142nd Place
- 5567 SE 142nd Place
- 5394 SE 136th Ave
- 4770 SE 140th Ave
- 0 SE 137th Ave Unit 385270617
- 13519 SE Harold St
- 13546 SE Steele St
- 13460 SE Raymond St
- 13851 SE Ramona St
- 4808 SE 134th Dr
- 14162 SE Holgate Blvd
- 13332 SE Harold St Unit 1
- 13810 SE Knight St
- 5200 SE 132nd Ave
- 5200 SE 132nd Ave Unit 12
- 13249 SE Schiller St
- 4802 SE 133rd Dr
- 6050 SE 136th Ave
- 13852 SE Henry St
- 5209 SE 140th Place
- 5221 SE 140th Place
- 5205 SE 140th Place
- 5212 SE 140th Ave
- 5204 SE 140th Ave
- 5218 SE 140th Ave
- 14035 SE Steele St Unit 1
- 14035 SE Steele St
- 14040 SE Mitchell St
- 5120 SE 140th Ave
- 14005 SE Steele St
- 5121 SE 140th Place
- 14041 SE Steele St
- 14010 SE Steele St
- 5116 SE 140th Ave
- 14046 SE Mitchell St
- 14006 SE Steele St
- 5304 SE 140th Ave
- 5115 SE 140th Place
- 14047 SE Steele St