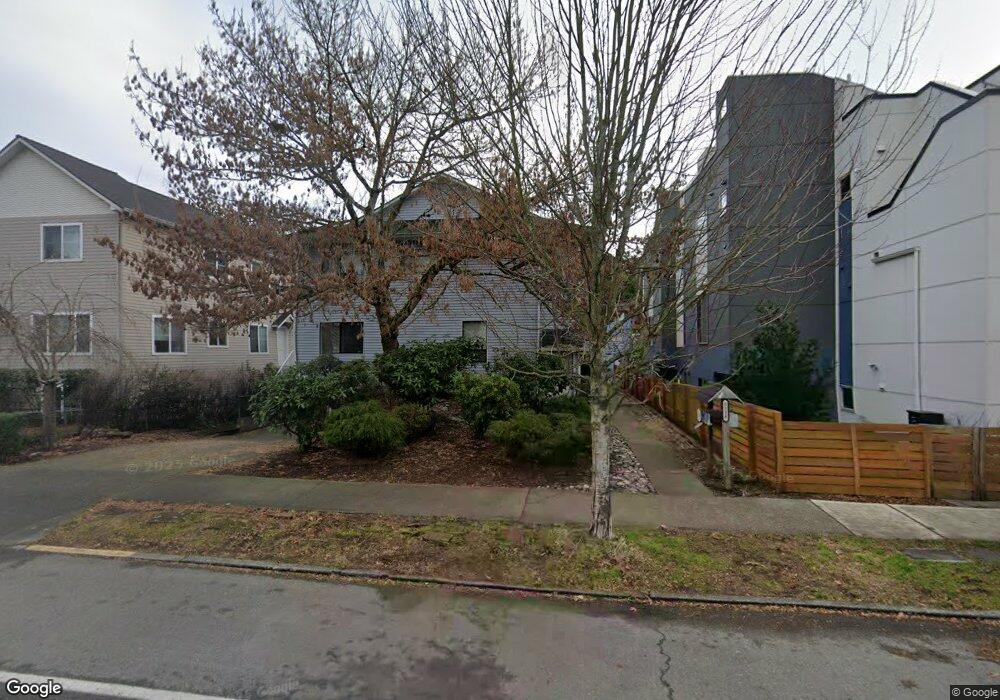
5218 Fauntleroy Way SW Unit 3 Seattle, WA 98136
Fairmount Park NeighborhoodEstimated Value: $605,000 - $719,000
2
Beds
3
Baths
1,177
Sq Ft
$573/Sq Ft
Est. Value
About This Home
This home is located at 5218 Fauntleroy Way SW Unit 3, Seattle, WA 98136 and is currently estimated at $674,168, approximately $572 per square foot. 5218 Fauntleroy Way SW Unit 3 is a home located in King County with nearby schools including Fairmount Park Elementary, Madison Middle School, and West Seattle High School.
Ownership History
Date
Name
Owned For
Owner Type
Purchase Details
Closed on
May 6, 2022
Sold by
Madrow Homes Llc
Bought by
Sst Family Investments Llc
Current Estimated Value
Purchase Details
Closed on
Apr 16, 1999
Sold by
Horn Constance D
Bought by
Lukens Kay A
Home Financials for this Owner
Home Financials are based on the most recent Mortgage that was taken out on this home.
Original Mortgage
$129,440
Interest Rate
7.1%
Purchase Details
Closed on
Apr 16, 1996
Sold by
Horn Constance D and Horn Wolfgang G
Bought by
Horn Constance D
Home Financials for this Owner
Home Financials are based on the most recent Mortgage that was taken out on this home.
Original Mortgage
$107,250
Interest Rate
7.41%
Mortgage Type
Balloon
Purchase Details
Closed on
Feb 23, 1993
Sold by
Turpen Ronald L and Turpen Lauren A
Bought by
Horn Constance D and Horn Wolfgang G
Create a Home Valuation Report for This Property
The Home Valuation Report is an in-depth analysis detailing your home's value as well as a comparison with similar homes in the area
Home Values in the Area
Average Home Value in this Area
Purchase History
| Date | Buyer | Sale Price | Title Company |
|---|---|---|---|
| Sst Family Investments Llc | $875,000 | Chicago Title | |
| Sst Family Investments Llc | $875,000 | Chicago Title | |
| Lukens Kay A | $161,808 | Evergreen Title Company Inc | |
| Horn Constance D | -- | First American Title | |
| Horn Constance D | $118,000 | -- |
Source: Public Records
Mortgage History
| Date | Status | Borrower | Loan Amount |
|---|---|---|---|
| Previous Owner | Lukens Kay A | $129,440 | |
| Previous Owner | Horn Constance D | $107,250 |
Source: Public Records
Tax History Compared to Growth
Tax History
| Year | Tax Paid | Tax Assessment Tax Assessment Total Assessment is a certain percentage of the fair market value that is determined by local assessors to be the total taxable value of land and additions on the property. | Land | Improvement |
|---|---|---|---|---|
| 2024 | $4,612 | $460,000 | $264,100 | $195,900 |
| 2023 | $4,394 | $497,000 | $264,100 | $232,900 |
| 2022 | $4,501 | $500,000 | $247,600 | $252,400 |
| 2021 | $4,328 | $474,000 | $231,100 | $242,900 |
| 2020 | $4,291 | $433,000 | $231,100 | $201,900 |
| 2018 | $3,347 | $352,000 | $198,100 | $153,900 |
| 2017 | $2,716 | $325,000 | $165,100 | $159,900 |
| 2016 | $2,421 | $270,000 | $132,000 | $138,000 |
| 2015 | $2,103 | $234,000 | $99,000 | $135,000 |
| 2014 | -- | $210,000 | $99,000 | $111,000 |
| 2013 | -- | $157,000 | $99,000 | $58,000 |
Source: Public Records
Map
Nearby Homes
- 5008 Fauntleroy Way SW Unit B
- 5202 35th Ave SW
- 4823 40th Ave SW Unit B&C
- 5420 California Ave SW
- 4853 42nd Ave SW
- 5430 California Ave SW Unit 3B
- 5001 California Ave SW Unit 511
- 4823 42nd Ave SW Unit B
- 5439 California Ave SW Unit H
- 4725 37th Ave SW
- 5907 40th Ave SW Unit B
- 5910 Fauntleroy Way SW
- 5915 Fauntleroy Way SW Unit D
- 5451 32nd Ave SW
- 4710 37th Ave SW Unit B
- 5935 Fauntleroy Way SW Unit A
- 5946 39th Ave SW
- 5627 44th Ave SW
- 5630 32nd Ave SW
- 5932 California Ave SW
- 5218 Fauntleroy Way SW Unit 1
- 5218 Fauntleroy Way SW Unit 4
- 5218 Fauntleroy Way SW Unit 2
- 5214 Fauntleroy Way SW Unit D
- 5214 Fauntleroy Way SW Unit A
- 5214 Fauntleroy Way SW Unit F
- 5214 Fauntleroy Way SW
- 5214 Fauntleroy Way SW Unit C
- 5214 Fauntleroy Way SW Unit E
- 5214 Fauntleroy Way SW Unit B
- 5226 Fauntleroy Way SW
- 5224 Fauntleroy Way SW
- 5228 Fauntleroy Way SW
- 5230 Fauntleroy Way SW
- 5214 Fauntleroy Way SW
- 5229 38th Ave SW Unit B
- 5229 38th Ave SW
- 5229 38th Ave SW Unit C
- 5215 38th Ave SW Unit 2
- 5215 38th Ave SW