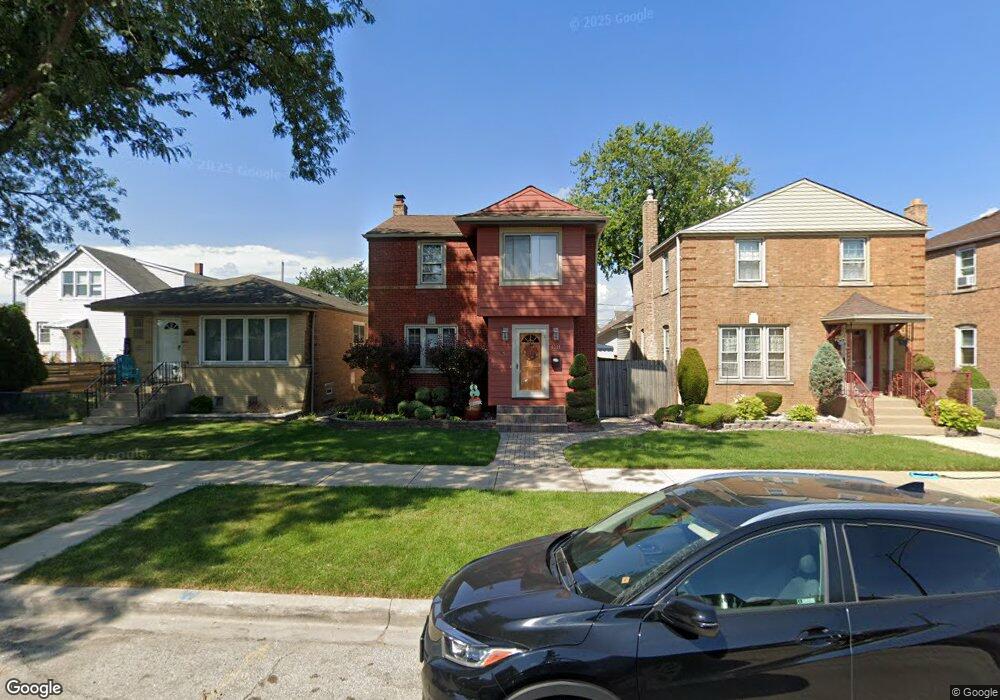
5218 S Moody Ave Chicago, IL 60638
Garfield Ridge NeighborhoodEstimated Value: $426,000 - $560,000
3
Beds
3
Baths
2,068
Sq Ft
$226/Sq Ft
Est. Value
About This Home
This home is located at 5218 S Moody Ave, Chicago, IL 60638 and is currently estimated at $467,893, approximately $226 per square foot. 5218 S Moody Ave is a home located in Cook County with nearby schools including Byrne Elementary School, Kennedy High School, and Gloria Dei Lutheran School.
Ownership History
Date
Name
Owned For
Owner Type
Purchase Details
Closed on
Jun 3, 2021
Sold by
Zuccaro Jenifer and Arredia Mark
Bought by
Arredia Jenifer and Arredia Mark
Current Estimated Value
Home Financials for this Owner
Home Financials are based on the most recent Mortgage that was taken out on this home.
Original Mortgage
$82,000
Outstanding Balance
$49,082
Interest Rate
2.9%
Mortgage Type
New Conventional
Estimated Equity
$418,811
Purchase Details
Closed on
Oct 22, 2012
Sold by
Arredia Mark and Zuccaro Jennifer
Bought by
Arredia Mark and Arredia Jenifer
Purchase Details
Closed on
Jul 31, 1996
Sold by
Pyrz Jan and Pyrz Danuta
Bought by
Arredia Mark and Zuccaro Jennifer
Home Financials for this Owner
Home Financials are based on the most recent Mortgage that was taken out on this home.
Original Mortgage
$124,000
Interest Rate
8.3%
Create a Home Valuation Report for This Property
The Home Valuation Report is an in-depth analysis detailing your home's value as well as a comparison with similar homes in the area
Home Values in the Area
Average Home Value in this Area
Purchase History
| Date | Buyer | Sale Price | Title Company |
|---|---|---|---|
| Arredia Jenifer | -- | Citywide Title Corporation | |
| Arredia Mark | -- | Citywide Title Corporation | |
| Arredia Mark | $155,000 | -- |
Source: Public Records
Mortgage History
| Date | Status | Borrower | Loan Amount |
|---|---|---|---|
| Open | Arredia Jenifer | $82,000 | |
| Closed | Arredia Mark | $124,000 |
Source: Public Records
Tax History Compared to Growth
Tax History
| Year | Tax Paid | Tax Assessment Tax Assessment Total Assessment is a certain percentage of the fair market value that is determined by local assessors to be the total taxable value of land and additions on the property. | Land | Improvement |
|---|---|---|---|---|
| 2024 | $7,782 | $38,000 | $5,775 | $32,225 |
| 2023 | $7,566 | $40,000 | $5,156 | $34,844 |
| 2022 | $7,566 | $40,000 | $5,156 | $34,844 |
| 2021 | $7,374 | $39,999 | $5,156 | $34,843 |
| 2020 | $6,064 | $30,147 | $4,125 | $26,022 |
| 2019 | $6,080 | $33,497 | $4,125 | $29,372 |
| 2018 | $5,977 | $33,497 | $4,125 | $29,372 |
| 2017 | $5,557 | $29,020 | $3,712 | $25,308 |
| 2016 | $5,347 | $29,020 | $3,712 | $25,308 |
| 2015 | $4,872 | $29,020 | $3,712 | $25,308 |
| 2014 | $4,223 | $25,154 | $3,506 | $21,648 |
| 2013 | $4,130 | $25,154 | $3,506 | $21,648 |
Source: Public Records
Map
Nearby Homes
- 5141 S Merrimac Ave
- 5128 S Meade Ave
- 5253 S Mobile Ave
- 5118 S Mobile Ave
- 5417 S Melvina Ave Unit 102
- 5142 S Mulligan Ave
- 5248 S Narragansett Ave
- 5421 S Mulligan Ave
- 6340 S Archer Ave
- 5245 S Mayfield Ave
- 5250 S Nagle Ave
- 5850 W 55th St Unit 3D
- 5621 S Moody Ave
- 5108 S Massasoit Ave
- 5112 S Nashville Ave
- 5533 S Menard Ave
- 5727 S Meade Ave
- 5127 S Parkside Ave
- 5712 W 56th St
- 5700 S Monitor Ave
- 5220 S Moody Ave
- 5216 S Moody Ave
- 5224 S Moody Ave
- 5212 S Moody Ave
- 5226 S Moody Ave
- 5208 S Moody Ave
- 5228 S Moody Ave
- 5232 S Moody Ave
- 5204 S Moody Ave
- 5219 S Melvina Ave
- 5215 S Melvina Ave
- 5223 S Melvina Ave
- 5234 S Moody Ave
- 5234 S Moody Ave Unit 2
- 5211 S Melvina Ave
- 5211 S Melvina Ave
- 5225 S Melvina Ave
- 5227 S Melvina Ave
- 5200 S Moody Ave
- 5209 S Melvina Ave