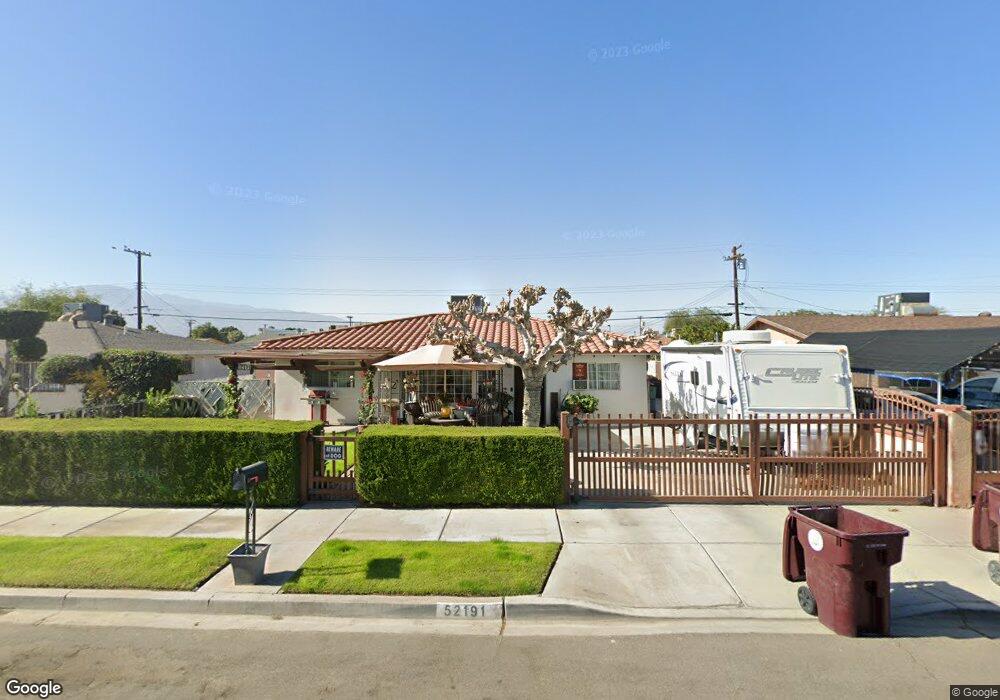
52191 Tripoli Way Coachella, CA 92236
Estimated Value: $315,000 - $402,000
3
Beds
2
Baths
1,707
Sq Ft
$214/Sq Ft
Est. Value
About This Home
This home is located at 52191 Tripoli Way, Coachella, CA 92236 and is currently estimated at $365,081, approximately $213 per square foot. 52191 Tripoli Way is a home located in Riverside County with nearby schools including Valley View Elementary School, Bobby Duke Middle School, and Coachella Valley High School.
Ownership History
Date
Name
Owned For
Owner Type
Purchase Details
Closed on
Jun 28, 2006
Sold by
Cv Investors Llc
Bought by
Cv Investors Llc
Current Estimated Value
Purchase Details
Closed on
Apr 20, 2006
Sold by
Cv Investors Llc
Bought by
Coachella Valley Land Co Inc
Purchase Details
Closed on
Nov 10, 2003
Sold by
Zamorez Daniel V and Zamorea Daniel V
Bought by
Contreras Antonio L and Contreras Norma Z
Purchase Details
Closed on
Aug 28, 2003
Sold by
Zamorez Daniel V
Bought by
Zamorea Daniel and Contreras Antonio L
Purchase Details
Closed on
Jan 15, 2002
Sold by
Shogun Ii Llc
Bought by
Westshore Development Co Llc
Purchase Details
Closed on
Oct 11, 1995
Sold by
Western Farm Credit Bank
Bought by
Shogun Ii Llc
Purchase Details
Closed on
Apr 1, 1994
Sold by
Zamorez Daniel V and Daniel Rosalinda Z
Bought by
Zamorez Daniel
Create a Home Valuation Report for This Property
The Home Valuation Report is an in-depth analysis detailing your home's value as well as a comparison with similar homes in the area
Home Values in the Area
Average Home Value in this Area
Purchase History
| Date | Buyer | Sale Price | Title Company |
|---|---|---|---|
| Cv Investors Llc | -- | First American Title Nhs | |
| Coachella Valley Land Co Inc | -- | First American Title Nhs | |
| Contreras Antonio L | -- | -- | |
| Zamorea Daniel | -- | -- | |
| Westshore Development Co Llc | -- | Stewart Title | |
| Shogun Ii Llc | -- | First American Title Ins Co | |
| Zamorez Daniel | -- | -- | |
| Contreras Norma Z | -- | -- | |
| Moya Merla Z | -- | -- | |
| Daniel Rosalinda | -- | -- | |
| Arriaga Yolanda Z | -- | -- | |
| Basquez Elvira Z | -- | -- | |
| Zamorez Manuel | -- | -- | |
| Zamorez Daniel Z | -- | -- | |
| Zamorez Daniel | -- | -- |
Source: Public Records
Tax History Compared to Growth
Tax History
| Year | Tax Paid | Tax Assessment Tax Assessment Total Assessment is a certain percentage of the fair market value that is determined by local assessors to be the total taxable value of land and additions on the property. | Land | Improvement |
|---|---|---|---|---|
| 2025 | $3,653 | $199,028 | $49,750 | $149,278 |
| 2023 | $3,653 | $191,301 | $47,819 | $143,482 |
| 2022 | $3,513 | $187,551 | $46,882 | $140,669 |
| 2021 | $3,443 | $183,874 | $45,963 | $137,911 |
| 2020 | $3,342 | $181,989 | $45,492 | $136,497 |
| 2019 | $3,258 | $178,421 | $44,600 | $133,821 |
| 2018 | $3,273 | $174,924 | $43,727 | $131,197 |
| 2017 | $3,206 | $171,495 | $42,870 | $128,625 |
| 2016 | $2,917 | $155,000 | $39,000 | $116,000 |
| 2015 | $2,612 | $136,000 | $34,000 | $102,000 |
| 2014 | $1,486 | $85,000 | $21,000 | $64,000 |
Source: Public Records
Map
Nearby Homes
- 53175 Cesar Chavez St
- 53049 Cesar Chavez St
- 0 Damascus Ave
- 52717 Calle Techa
- 52066 Channing Ct
- 53079 Cesar Chavez St
- 83904 52nd Ave
- 0 52nd Ave Unit 219131177DA
- 0 Palm Ave
- 51812 Sunset Dr
- 50529 Grapefruit Blvd
- 53020 Torino Place
- 52313 Calle Alicia
- 1449 3rd St
- 85675 Michelle Dr
- 84461 Vermouth Dr
- 1423 2nd St
- 85158 Avenida Tacuba
- 50442 S Kenmore St
- 437 Vine Ave
- 52173 Tripoli Way
- 52211 Tripoli Way
- 52192 Jennifer Way
- 52174 Jennifer Way
- 52210 Jennifer Way
- 52155 Tripoli Way
- 52229 Tripoli Way
- 52156 Jennifer Way
- 52228 Jennifer Way
- 52210 Tripoli Way
- 52174 Tripoli Way
- 52137 Tripoli Way
- 52247 Tripoli Way
- 52228 Tripoli Way
- 52138 Jennifer Way
- 52156 Tripoli Way
- 52246 Jennifer Way
- 52246 Tripoli Way
- 52265 Tripoli Way
- 52138 Tripoli Way