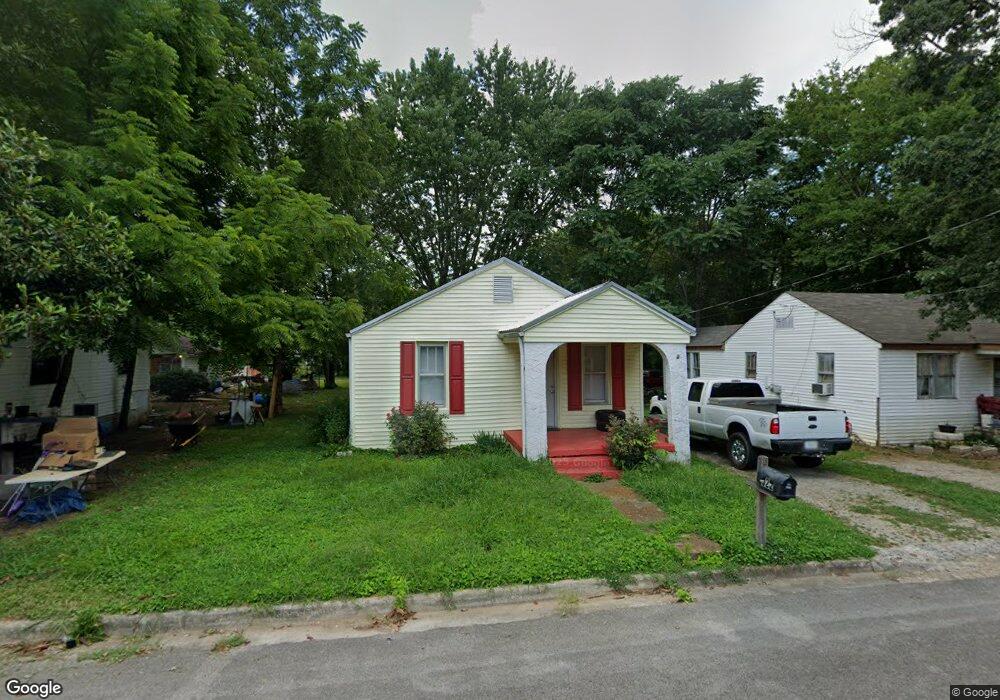
522 3rd St Lawrenceburg, TN 38464
Estimated Value: $69,755 - $144,000
Studio
1
Bath
864
Sq Ft
$125/Sq Ft
Est. Value
About This Home
This home is located at 522 3rd St, Lawrenceburg, TN 38464 and is currently estimated at $107,939, approximately $124 per square foot. 522 3rd St is a home located in Lawrence County with nearby schools including Ingram Sowell Elementary School, Lawrenceburg Public Elementary School, and David Crockett Elementary School.
Ownership History
Date
Name
Owned For
Owner Type
Purchase Details
Closed on
Dec 13, 2023
Sold by
Odeneal Stacie L
Bought by
Aranda Jesus M and Saravia Sonia E
Current Estimated Value
Purchase Details
Closed on
May 2, 2011
Sold by
Odeneal K C
Bought by
Odeneal Stacie
Purchase Details
Closed on
May 4, 2010
Sold by
Citimortgage Inc
Bought by
Odeneal K C
Purchase Details
Closed on
Mar 29, 2010
Sold by
Spray Billy
Bought by
Citimortgage Inc
Purchase Details
Closed on
Sep 28, 2005
Sold by
Rick Holland
Bought by
Billy Spray
Home Financials for this Owner
Home Financials are based on the most recent Mortgage that was taken out on this home.
Original Mortgage
$23,920
Interest Rate
5.66%
Purchase Details
Closed on
Jun 3, 2004
Sold by
Evit Weathers Johnny and Evit Estat
Bought by
Rick Holland
Purchase Details
Closed on
May 15, 1987
Bought by
Weathers Johnny
Purchase Details
Closed on
Jan 1, 1983
Bought by
Weathers Duveen and Husband Johnny
Purchase Details
Closed on
Jan 1, 1982
Create a Home Valuation Report for This Property
The Home Valuation Report is an in-depth analysis detailing your home's value as well as a comparison with similar homes in the area
Home Values in the Area
Average Home Value in this Area
Purchase History
| Date | Buyer | Sale Price | Title Company |
|---|---|---|---|
| Aranda Jesus M | $35,000 | None Listed On Document | |
| Odeneal Stacie | $16,000 | -- | |
| Odeneal K C | $12,500 | -- | |
| Citimortgage Inc | $13,195 | -- | |
| Billy Spray | $29,900 | -- | |
| Rick Holland | $28,000 | -- | |
| Weathers Johnny | $100 | -- | |
| Weathers Duveen | $9,000 | -- | |
| -- | $4,500 | -- |
Source: Public Records
Mortgage History
| Date | Status | Borrower | Loan Amount |
|---|---|---|---|
| Previous Owner | Not Available | $23,920 |
Source: Public Records
Tax History
| Year | Tax Paid | Tax Assessment Tax Assessment Total Assessment is a certain percentage of the fair market value that is determined by local assessors to be the total taxable value of land and additions on the property. | Land | Improvement |
|---|---|---|---|---|
| 2025 | $408 | $13,150 | $1,500 | $11,650 |
| 2024 | $408 | $13,150 | $1,500 | $11,650 |
| 2023 | $408 | $13,150 | $1,500 | $11,650 |
| 2022 | $408 | $13,150 | $1,500 | $11,650 |
| 2021 | $319 | $7,250 | $1,500 | $5,750 |
| 2020 | $319 | $7,250 | $1,500 | $5,750 |
| 2019 | $319 | $7,250 | $1,500 | $5,750 |
| 2018 | $319 | $7,250 | $1,500 | $5,750 |
| 2017 | $319 | $7,250 | $1,500 | $5,750 |
| 2016 | $319 | $7,250 | $1,500 | $5,750 |
| 2015 | $302 | $7,250 | $1,500 | $5,750 |
| 2014 | $290 | $6,975 | $1,500 | $5,475 |
Source: Public Records
Map
Nearby Homes
Your Personal Tour Guide
Ask me questions while you tour the home.