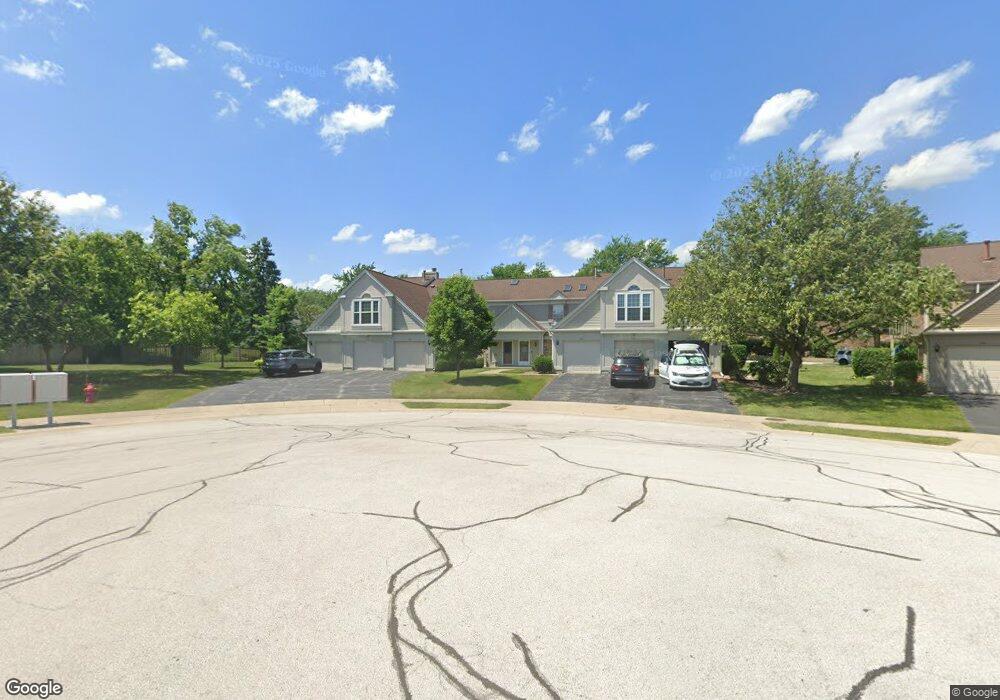
522 Bridle Trail Unit 176 Wheeling, IL 60090
Estimated Value: $207,000 - $263,000
2
Beds
1
Bath
178,310
Sq Ft
$1/Sq Ft
Est. Value
About This Home
This home is located at 522 Bridle Trail Unit 176, Wheeling, IL 60090 and is currently estimated at $240,259, approximately $1 per square foot. 522 Bridle Trail Unit 176 is a home located in Cook County with nearby schools including Dwight D Eisenhower Elementary School, Anne Sullivan Elementary School, and Betsy Ross Elementary School.
Ownership History
Date
Name
Owned For
Owner Type
Purchase Details
Closed on
Aug 12, 2014
Sold by
Gil Rafal and Gil Marta
Bought by
Gil Rafal
Current Estimated Value
Purchase Details
Closed on
Jun 11, 2007
Sold by
Orourke Thomas W and Orourke Vanessa
Bought by
Gil Rafal and Gil Marta
Home Financials for this Owner
Home Financials are based on the most recent Mortgage that was taken out on this home.
Original Mortgage
$169,500
Interest Rate
8.87%
Mortgage Type
Purchase Money Mortgage
Purchase Details
Closed on
Mar 17, 1999
Sold by
Sims William W
Bought by
Orourke Thomas W
Home Financials for this Owner
Home Financials are based on the most recent Mortgage that was taken out on this home.
Original Mortgage
$84,240
Interest Rate
6.5%
Purchase Details
Closed on
Aug 31, 1993
Sold by
Maddox Yvonne R and Dunham Dudley W
Bought by
Rolling Hills Nursery Inc
Create a Home Valuation Report for This Property
The Home Valuation Report is an in-depth analysis detailing your home's value as well as a comparison with similar homes in the area
Home Values in the Area
Average Home Value in this Area
Purchase History
| Date | Buyer | Sale Price | Title Company |
|---|---|---|---|
| Gil Rafal | -- | -- | |
| Gil Rafal | -- | -- | |
| Gil Rafal | -- | -- | |
| Gil Rafal | $169,500 | Ticor Title Insurance Co | |
| Gil Rafal | $169,500 | Ticor Title Insurance Co | |
| Orourke Thomas W | $105,500 | -- | |
| Sims William W | -- | -- | |
| Rolling Hills Nursery Inc | $61,666 | -- |
Source: Public Records
Mortgage History
| Date | Status | Borrower | Loan Amount |
|---|---|---|---|
| Previous Owner | Gil Rafal | $169,500 | |
| Previous Owner | Orourke Thomas W | $84,240 | |
| Closed | Orourke Thomas W | $10,530 |
Source: Public Records
Tax History Compared to Growth
Tax History
| Year | Tax Paid | Tax Assessment Tax Assessment Total Assessment is a certain percentage of the fair market value that is determined by local assessors to be the total taxable value of land and additions on the property. | Land | Improvement |
|---|---|---|---|---|
| 2024 | $3,812 | $16,138 | $4,251 | $11,887 |
| 2023 | $3,611 | $16,138 | $4,251 | $11,887 |
| 2022 | $3,611 | $16,138 | $4,251 | $11,887 |
| 2021 | $3,157 | $12,862 | $483 | $12,379 |
| 2020 | $3,145 | $12,862 | $483 | $12,379 |
| 2019 | $3,166 | $14,355 | $483 | $13,872 |
| 2018 | $2,253 | $10,515 | $386 | $10,129 |
| 2017 | $2,240 | $10,515 | $386 | $10,129 |
| 2016 | $2,340 | $10,515 | $386 | $10,129 |
| 2015 | $2,030 | $9,037 | $2,221 | $6,816 |
| 2014 | $2,118 | $9,436 | $2,221 | $7,215 |
| 2013 | $2,037 | $9,436 | $2,221 | $7,215 |
Source: Public Records
Map
Nearby Homes
- 1054 Shady Tree Ln
- 1201 Pleasant Run Dr Unit 312
- 688 Equestrian Dr
- 1430 Sandstone Dr Unit 202
- 1425 Sandpebble Dr Unit 340
- 1450 Sandpebble Dr Unit 333
- 1450 Sandpebble Dr Unit 227
- 1500 Sandstone Dr Unit 307
- 940 Tanglewood Dr
- 1550 Sandpebble Dr Unit 307
- 1550 Sandpebble Dr Unit 209
- 1014 N Elmhurst Rd
- 1575 Sandpebble Dr Unit 226
- 1575 Sandpebble Dr Unit 336
- 9 Kenneth Ave
- 21 E Stonegate Dr
- 802 Andover Ct
- 200 Violet Ln
- 751 Garth Rd
- 1033 Wheeling Rd
- 520 Bridle Trail Unit 175
- 524 Bridle Trail Unit 174
- 526 Bridle Trail Unit 173
- 508 Bridle Trail Unit 181
- 510 Bridle Trail Unit 182
- 528 Bridle Trail Unit 171
- 530 Bridle Trail Unit 172
- 506 Bridle Trail Unit 183
- 504 Bridle Trail Unit 184
- 502 Bridle Trail Unit 186
- 500 Bridle Trail Unit 185
- 1265 S Paddock Dr
- 486 Pleasant Run Dr Unit 6
- 486 Pleasant Run Dr Unit 4
- 486 Pleasant Run Dr
- 1275 S Paddock Dr
- 490 Bridle Trail Unit 192
- 488 Bridle Trail Unit 191
- 531 Bridle Trail Unit 165
- 486 Bridle Trail Unit 193