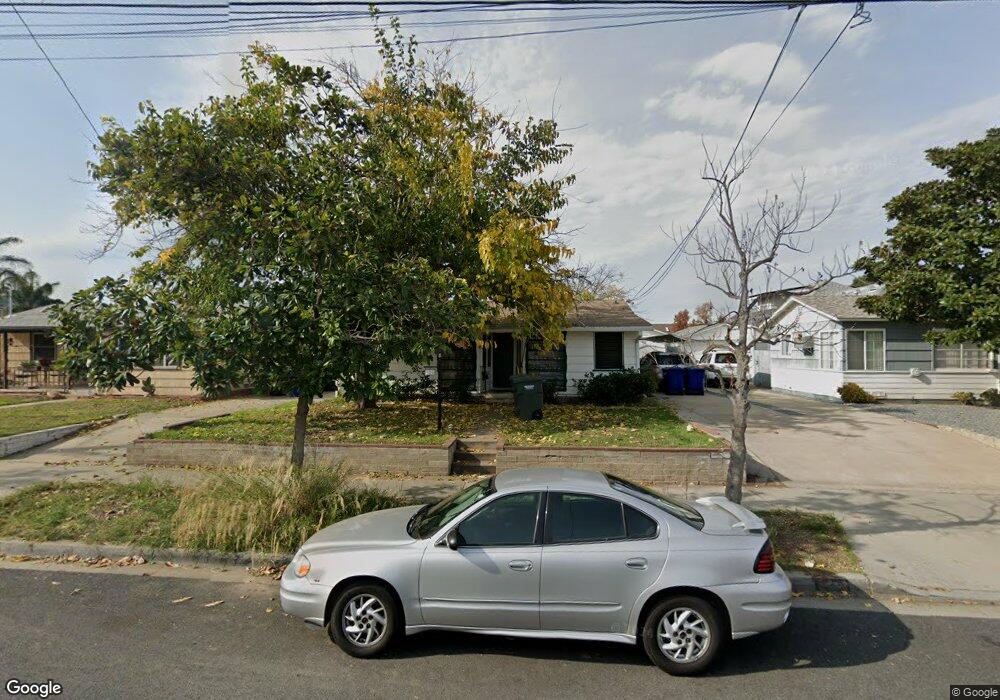
522 Claydelle Ave El Cajon, CA 92020
Estimated Value: $643,000 - $753,000
3
Beds
2
Baths
1,239
Sq Ft
$556/Sq Ft
Est. Value
About This Home
This home is located at 522 Claydelle Ave, El Cajon, CA 92020 and is currently estimated at $689,133, approximately $556 per square foot. 522 Claydelle Ave is a home located in San Diego County with nearby schools including Chase Avenue Elementary School, Cajon Valley Middle School, and Bostonia Global High School.
Ownership History
Date
Name
Owned For
Owner Type
Purchase Details
Closed on
Mar 27, 1998
Sold by
Austin Scott E and Austin Melanie
Bought by
Austin Scott E and Austin Melanie
Current Estimated Value
Home Financials for this Owner
Home Financials are based on the most recent Mortgage that was taken out on this home.
Original Mortgage
$114,300
Outstanding Balance
$21,508
Interest Rate
7%
Estimated Equity
$667,625
Purchase Details
Closed on
Dec 11, 1996
Sold by
Federal Home Loan Mortgage
Bought by
Austin Scott E and Jacobs Melanie
Home Financials for this Owner
Home Financials are based on the most recent Mortgage that was taken out on this home.
Original Mortgage
$115,700
Interest Rate
7.53%
Purchase Details
Closed on
Jul 25, 1996
Sold by
Eickhoff Andrew J and Eickhoff Yoshiko S
Bought by
Federal Home Loan Mortgage Corporation
Purchase Details
Closed on
Oct 30, 1991
Create a Home Valuation Report for This Property
The Home Valuation Report is an in-depth analysis detailing your home's value as well as a comparison with similar homes in the area
Home Values in the Area
Average Home Value in this Area
Purchase History
| Date | Buyer | Sale Price | Title Company |
|---|---|---|---|
| Austin Scott E | -- | First American Title | |
| Austin Scott E | $105,500 | First American Title Company | |
| Federal Home Loan Mortgage Corporation | $112,288 | Chicago Title Co | |
| -- | $135,000 | -- |
Source: Public Records
Mortgage History
| Date | Status | Borrower | Loan Amount |
|---|---|---|---|
| Open | Austin Scott E | $114,300 | |
| Closed | Austin Scott E | $115,700 |
Source: Public Records
Tax History Compared to Growth
Tax History
| Year | Tax Paid | Tax Assessment Tax Assessment Total Assessment is a certain percentage of the fair market value that is determined by local assessors to be the total taxable value of land and additions on the property. | Land | Improvement |
|---|---|---|---|---|
| 2025 | $2,677 | $171,796 | $89,562 | $82,234 |
| 2024 | $2,677 | $168,428 | $87,806 | $80,622 |
| 2023 | $3,015 | $165,127 | $86,085 | $79,042 |
| 2022 | $2,479 | $161,891 | $84,398 | $77,493 |
| 2021 | $2,477 | $158,718 | $82,744 | $75,974 |
| 2020 | $2,377 | $157,091 | $81,896 | $75,195 |
| 2019 | $1,828 | $154,012 | $80,291 | $73,721 |
| 2018 | $1,797 | $150,993 | $78,717 | $72,276 |
| 2017 | $30 | $148,033 | $77,174 | $70,859 |
| 2016 | $1,699 | $145,131 | $75,661 | $69,470 |
| 2015 | $1,690 | $142,952 | $74,525 | $68,427 |
| 2014 | $1,656 | $140,153 | $73,066 | $67,087 |
Source: Public Records
Map
Nearby Homes
- 188 S Lincoln Ave Unit 22
- 652 S Orange Ave
- 0 Rea Ave
- 606 S Mollison Ave Unit A
- 602 S Mollison Ave
- 855 E Lexington Ave Unit 4
- 267 S Mollison Ave Unit 16
- 267 S Mollison Ave Unit 5
- 272 Indiana Ave
- 486 S Anza St
- 351 Connecticut Ave
- 403 Emerald Ave Unit 8
- 373 Connecticut Ave
- 1006 Avocado Ave
- 851 S Mollison Ave Unit 29
- 908 S Sunshine Ave Unit 18
- 975-89 S Lincoln Ave
- 868 Pearl Place
- 410 S 1st St Unit 185
- 410 S 1st St Unit 30
- 530 Claydelle Ave
- 267 E Camden Ave Unit 69
- 534 Claydelle Ave
- 602 Claydelle Ave
- 505 Prescott Ave
- 610 Claydelle Ave
- 521 Claydelle Ave
- 237 E Camden Ave
- 527 Claydelle Ave
- 525 Prescott Ave
- 509 Claydelle Ave
- 533 Claydelle Ave
- 482 Claydelle Ave
- 515 Prescott Ave
- 620 Claydelle Ave
- 535 Prescott Ave
- 607 Claydelle Ave
- 471 Claydelle Ave
- 545 Prescott Ave
- 632 Claydelle Ave