Estimated Value: $155,000 - $298,000
3
Beds
2
Baths
2,234
Sq Ft
$96/Sq Ft
Est. Value
About This Home
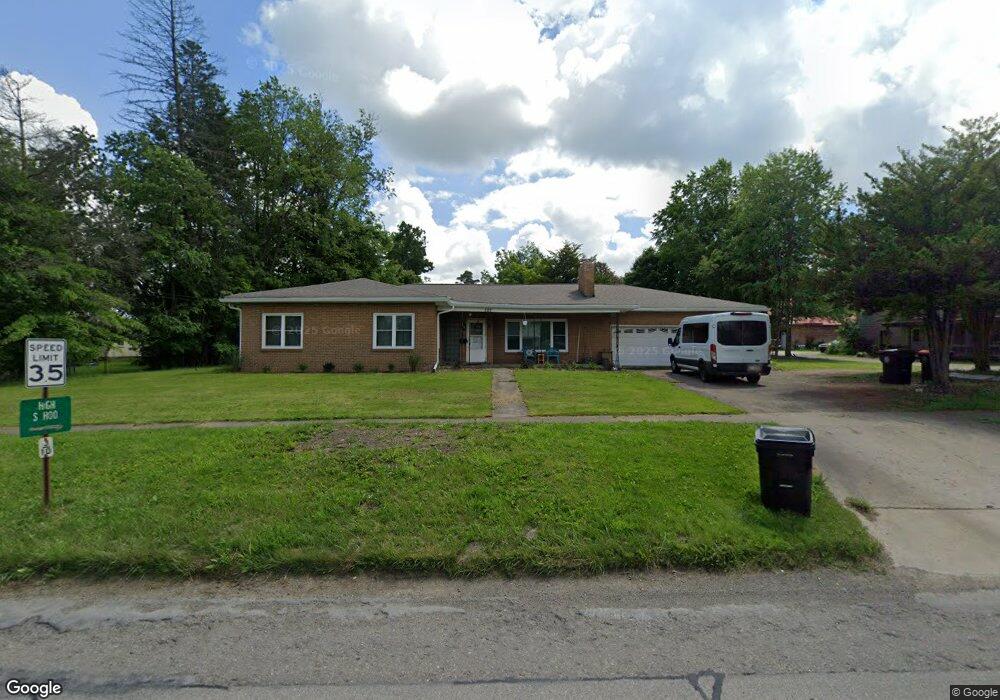
This home is located at 522 E Main St, Corry, PA 16407 and is currently estimated at $214,543, approximately $96 per square foot. 522 E Main St is a home located in Erie County with nearby schools including Corry Area Primary School, Corry Area Intermediate School, and Corry Area Middle School.
Ownership History
Date
Name
Owned For
Owner Type
Purchase Details
Closed on
Aug 4, 2021
Sold by
Bean Gregory T
Bought by
Zupanc Jeffrey
Current Estimated Value
Purchase Details
Closed on
Mar 5, 2020
Sold by
Erie County Tax Claim Bureau
Bought by
Bean Gregory T
Purchase Details
Closed on
Aug 16, 2012
Sold by
Sorenson Mary Jane
Bought by
Proctor Paula M
Purchase Details
Closed on
Mar 28, 2012
Sold by
Stright William E and Stright Jamie
Bought by
Sorenson Mary Jane
Purchase Details
Closed on
Jun 8, 2004
Sold by
Sorenson Mary Jane
Bought by
Sorenson Mary Jane and Stright William E
Create a Home Valuation Report for This Property
The Home Valuation Report is an in-depth analysis detailing your home's value as well as a comparison with similar homes in the area
Home Values in the Area
Average Home Value in this Area
Purchase History
| Date | Buyer | Sale Price | Title Company |
|---|---|---|---|
| Zupanc Jeffrey | $46,000 | None Listed On Document | |
| Bean Gregory T | $128,094 | None Available | |
| Proctor Paula M | $52,000 | None Available | |
| Sorenson Mary Jane | -- | None Available | |
| Sorenson Mary Jane | -- | -- |
Source: Public Records
Tax History
| Year | Tax Paid | Tax Assessment Tax Assessment Total Assessment is a certain percentage of the fair market value that is determined by local assessors to be the total taxable value of land and additions on the property. | Land | Improvement |
|---|---|---|---|---|
| 2025 | $3,774 | $115,400 | $7,800 | $107,600 |
| 2024 | $3,749 | $115,400 | $7,800 | $107,600 |
| 2023 | $3,657 | $115,400 | $7,800 | $107,600 |
| 2022 | $3,588 | $115,400 | $7,800 | $107,600 |
| 2021 | $3,562 | $115,400 | $7,800 | $107,600 |
| 2020 | $3,534 | $115,400 | $7,800 | $107,600 |
| 2019 | $3,477 | $115,400 | $7,800 | $107,600 |
| 2018 | $3,431 | $115,400 | $7,800 | $107,600 |
| 2017 | $3,372 | $115,400 | $7,800 | $107,600 |
| 2016 | $3,474 | $115,400 | $7,800 | $107,600 |
| 2015 | $3,445 | $115,400 | $7,800 | $107,600 |
| 2014 | $1,398 | $115,400 | $7,800 | $107,600 |
Source: Public Records
Map
Nearby Homes
- 533 E South St
- 425 E Pleasant St
- 219 Summer St
- 433 E Pleasant St
- 604 E South St Unit 2
- 515 Catherine St
- 46375 6th St
- 35 W Smith St
- 535 Wright St
- 27 W Frederick St
- 110-118 W Smith and 307 Grace St
- 820 Mead Ave
- 671 E Columbus Ave
- 40 Marion St
- 503 W Washington St
- 132 Random Rd
- 1026 N Center St
- 837 Us Highway 6
- 538 Grand St
- 318 Worth St
Your Personal Tour Guide
Ask me questions while you tour the home.