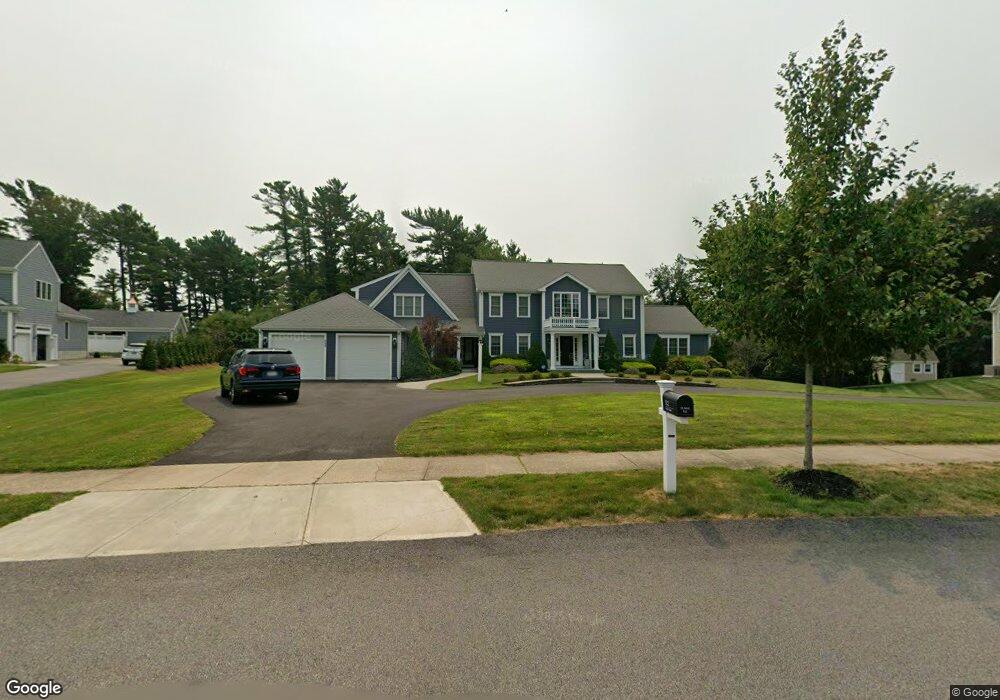
522 Holly Rd Marshfield, MA 02050
Estimated Value: $1,325,000 - $1,545,000
4
Beds
5
Baths
3,215
Sq Ft
$453/Sq Ft
Est. Value
About This Home
This home is located at 522 Holly Rd, Marshfield, MA 02050 and is currently estimated at $1,457,074, approximately $453 per square foot. 522 Holly Rd is a home located in Plymouth County with nearby schools including Eames Way School, Furnace Brook Middle School, and Marshfield High School.
Ownership History
Date
Name
Owned For
Owner Type
Purchase Details
Closed on
Dec 19, 2016
Sold by
Chestnut Hill Estates
Bought by
Bohorquez Jaime and Bohorquez Joan E
Current Estimated Value
Home Financials for this Owner
Home Financials are based on the most recent Mortgage that was taken out on this home.
Original Mortgage
$523,250
Outstanding Balance
$416,041
Interest Rate
3.54%
Mortgage Type
Purchase Money Mortgage
Estimated Equity
$1,041,033
Purchase Details
Closed on
Oct 29, 2009
Sold by
Millpond Builders Inc
Bought by
Chestnut Hill Estates
Purchase Details
Closed on
Jan 4, 2006
Sold by
Chestnut Hill Est Llc and Darman
Bought by
Millpond Bldrs Inc
Home Financials for this Owner
Home Financials are based on the most recent Mortgage that was taken out on this home.
Original Mortgage
$613,500
Interest Rate
6.28%
Mortgage Type
Purchase Money Mortgage
Create a Home Valuation Report for This Property
The Home Valuation Report is an in-depth analysis detailing your home's value as well as a comparison with similar homes in the area
Home Values in the Area
Average Home Value in this Area
Purchase History
We collect this data history from publicly available records. To have your information removed, we recommend requesting removal directly through your county’s website.
| Date | Buyer | Sale Price | Title Company |
|---|---|---|---|
| Bohorquez Jaime | $775,000 | -- | |
| Chestnut Hill Estates | $400,000 | -- | |
| Millpond Bldrs Inc | $350,000 | -- |
Source: Public Records
Mortgage History
We collect this data history from publicly available records. To have your information removed, we recommend requesting removal directly through your county’s website.
| Date | Status | Borrower | Loan Amount |
|---|---|---|---|
| Open | Bohorquez Jaime | $523,250 | |
| Previous Owner | Millpond Bldrs Inc | $613,500 |
Source: Public Records
Tax History
| Year | Tax Paid | Tax Assessment Tax Assessment Total Assessment is a certain percentage of the fair market value that is determined by local assessors to be the total taxable value of land and additions on the property. | Land | Improvement |
|---|---|---|---|---|
| 2025 | $12,784 | $1,291,300 | $376,900 | $914,400 |
| 2024 | $12,345 | $1,188,200 | $355,100 | $833,100 |
| 2023 | $11,625 | $1,050,000 | $319,600 | $730,400 |
| 2022 | $11,625 | $897,700 | $266,900 | $630,800 |
| 2021 | $11,069 | $839,200 | $266,900 | $572,300 |
| 2020 | $10,992 | $824,600 | $266,900 | $557,700 |
| 2019 | $10,642 | $795,400 | $266,900 | $528,500 |
| 2018 | $10,503 | $785,600 | $266,900 | $518,700 |
| 2017 | $10,335 | $753,300 | $266,900 | $486,400 |
| 2016 | $9,480 | $683,000 | $256,000 | $427,000 |
| 2015 | $8,952 | $673,600 | $256,000 | $417,600 |
| 2014 | $9,053 | $681,200 | $256,000 | $425,200 |
Source: Public Records
Map
Nearby Homes
Your Personal Tour Guide
Ask me questions while you tour the home.