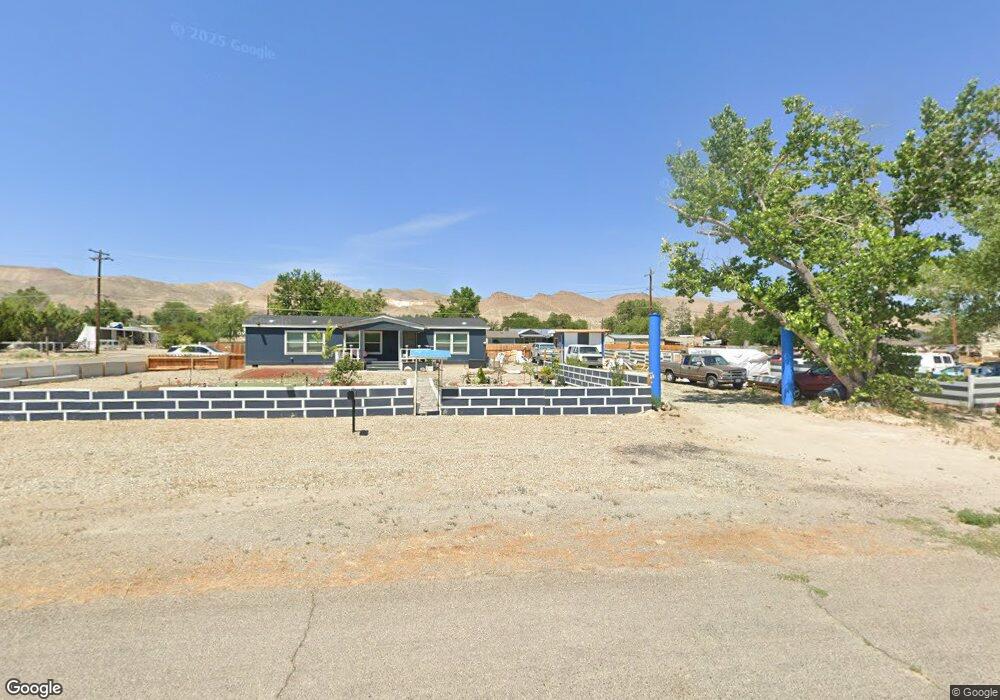
522 Mason Ave Unit 3 Yerington, NV 89447
Estimated Value: $50,000 - $246,572
--
Bed
--
Bath
880
Sq Ft
$147/Sq Ft
Est. Value
About This Home
This home is located at 522 Mason Ave Unit 3, Yerington, NV 89447 and is currently estimated at $129,191, approximately $146 per square foot. 522 Mason Ave Unit 3 is a home located in Lyon County with nearby schools including Yerington Elementary School, Yerington Intermediate School, and Yerington High School.
Ownership History
Date
Name
Owned For
Owner Type
Purchase Details
Closed on
Oct 3, 2023
Sold by
Cheryl Ann Barron Revocable Living Trust
Bought by
Gomez Ignacio Gonzalez and Gomez Ziola Violeta
Current Estimated Value
Home Financials for this Owner
Home Financials are based on the most recent Mortgage that was taken out on this home.
Original Mortgage
$33,600
Outstanding Balance
$28,878
Interest Rate
7.19%
Mortgage Type
New Conventional
Estimated Equity
$100,313
Purchase Details
Closed on
Oct 23, 2020
Sold by
Barron Cheryl Ann and Barron Cheryl
Bought by
Barron Cheryl Ann and Cheryl Ann Baron Revocable Living Trust
Purchase Details
Closed on
May 29, 2020
Sold by
Davarpanah Malek R and Davarpanah Jody Mckenzie
Bought by
Barron Cheryl
Purchase Details
Closed on
May 26, 2018
Sold by
Hennan Craig
Bought by
Davarpanah Malek R and Davarpanah Jody Mckenzie
Create a Home Valuation Report for This Property
The Home Valuation Report is an in-depth analysis detailing your home's value as well as a comparison with similar homes in the area
Home Values in the Area
Average Home Value in this Area
Purchase History
| Date | Buyer | Sale Price | Title Company |
|---|---|---|---|
| Gomez Ignacio Gonzalez | $42,000 | Stewart Title | |
| Barron Cheryl Ann | -- | None Available | |
| Barron Cheryl | $55,000 | None Available | |
| Davarpanah Malek R | $10,000 | None Available |
Source: Public Records
Mortgage History
| Date | Status | Borrower | Loan Amount |
|---|---|---|---|
| Open | Gomez Ignacio Gonzalez | $33,600 |
Source: Public Records
Tax History Compared to Growth
Tax History
| Year | Tax Paid | Tax Assessment Tax Assessment Total Assessment is a certain percentage of the fair market value that is determined by local assessors to be the total taxable value of land and additions on the property. | Land | Improvement |
|---|---|---|---|---|
| 2025 | $1,995 | $68,764 | $21,175 | $47,590 |
| 2024 | $293 | $11,835 | $10,500 | $1,335 |
| 2023 | $293 | $11,813 | $10,500 | $1,313 |
| 2022 | $252 | $11,820 | $10,500 | $1,320 |
| 2021 | $235 | $12,006 | $10,700 | $1,306 |
| 2020 | $218 | $11,991 | $10,700 | $1,291 |
| 2019 | $205 | $11,566 | $10,700 | $866 |
| 2018 | $190 | $5,114 | $4,270 | $844 |
| 2017 | $186 | $5,117 | $4,270 | $847 |
| 2016 | $181 | $4,913 | $4,270 | $643 |
| 2015 | $181 | $4,800 | $4,270 | $530 |
| 2014 | $176 | $5,054 | $4,270 | $784 |
Source: Public Records
Map
Nearby Homes