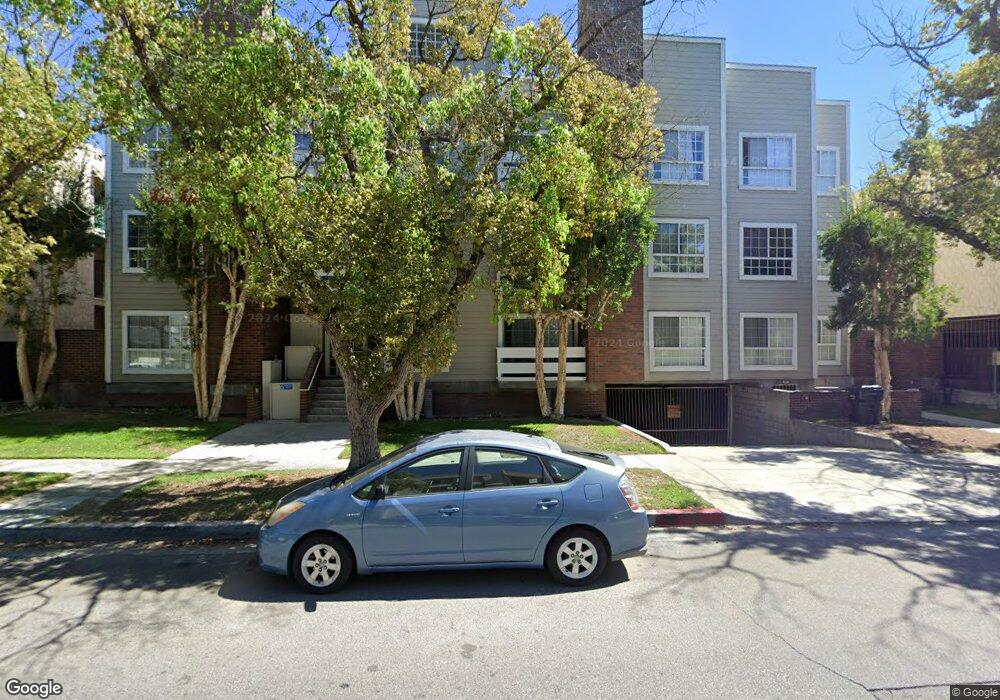
522 N Jackson St Unit 204 Glendale, CA 91206
City Center NeighborhoodEstimated Value: $629,518 - $792,000
2
Beds
2
Baths
1,171
Sq Ft
$577/Sq Ft
Est. Value
About This Home
This home is located at 522 N Jackson St Unit 204, Glendale, CA 91206 and is currently estimated at $675,630, approximately $576 per square foot. 522 N Jackson St Unit 204 is a home located in Los Angeles County with nearby schools including R.D. White Elementary School, Woodrow Wilson Middle School, and Glendale High School.
Ownership History
Date
Name
Owned For
Owner Type
Purchase Details
Closed on
Mar 22, 2020
Sold by
Artounians Artoom and Artounians Sedik
Bought by
Artounians Artoom and Artounians Sedik
Current Estimated Value
Purchase Details
Closed on
Jan 19, 2005
Sold by
Artounians Artoom and Artounians Sedik
Bought by
Artounians Artoom
Home Financials for this Owner
Home Financials are based on the most recent Mortgage that was taken out on this home.
Original Mortgage
$95,000
Outstanding Balance
$47,774
Interest Rate
5.69%
Mortgage Type
Credit Line Revolving
Estimated Equity
$627,856
Purchase Details
Closed on
Sep 4, 2003
Sold by
Hovanessian Halkaz and Hovanessian Almas
Bought by
Artounians Artoon
Home Financials for this Owner
Home Financials are based on the most recent Mortgage that was taken out on this home.
Original Mortgage
$204,000
Outstanding Balance
$89,795
Interest Rate
5.5%
Mortgage Type
New Conventional
Estimated Equity
$585,835
Create a Home Valuation Report for This Property
The Home Valuation Report is an in-depth analysis detailing your home's value as well as a comparison with similar homes in the area
Home Values in the Area
Average Home Value in this Area
Purchase History
| Date | Buyer | Sale Price | Title Company |
|---|---|---|---|
| Artounians Artoom | -- | None Available | |
| Artounians Artoom | -- | American Coast Title Company | |
| Artounians Artoon | $255,000 | Investors Title |
Source: Public Records
Mortgage History
| Date | Status | Borrower | Loan Amount |
|---|---|---|---|
| Open | Artounians Artoom | $95,000 | |
| Open | Artounians Artoon | $204,000 | |
| Closed | Artounians Artoon | $25,500 |
Source: Public Records
Tax History Compared to Growth
Tax History
| Year | Tax Paid | Tax Assessment Tax Assessment Total Assessment is a certain percentage of the fair market value that is determined by local assessors to be the total taxable value of land and additions on the property. | Land | Improvement |
|---|---|---|---|---|
| 2025 | $3,992 | $362,540 | $220,369 | $142,171 |
| 2024 | $3,992 | $355,433 | $216,049 | $139,384 |
| 2023 | $3,902 | $348,464 | $211,813 | $136,651 |
| 2022 | $3,831 | $341,632 | $207,660 | $133,972 |
| 2021 | $3,763 | $334,935 | $203,589 | $131,346 |
| 2019 | $3,618 | $325,002 | $197,551 | $127,451 |
| 2018 | $3,567 | $318,630 | $193,678 | $124,952 |
| 2016 | $3,396 | $306,258 | $186,158 | $120,100 |
| 2015 | $3,327 | $301,658 | $183,362 | $118,296 |
| 2014 | $3,302 | $295,750 | $179,771 | $115,979 |
Source: Public Records
Map
Nearby Homes
- 520 N Louise St Unit 207
- 620 N Kenwood St Unit 309
- 500 Jackson Place Unit 224
- 341 N Isabel St
- 605 N Louise St Unit 106
- 426 N Maryland Ave Unit 103
- 310 N Jackson St Unit 106
- 310 N Jackson St Unit 330
- 330 N Jackson St Unit 313
- 719 N Jackson St
- 312 N Louise St Unit 210
- 400 Monterey Rd Unit 11
- 330 N Howard St Unit 212
- 330 N Howard St Unit 311
- 330 N Howard St Unit 201
- 300 N Isabel St Unit 10
- 300 N Isabel St Unit 21
- 315 N Louise St Unit 103
- 316 N Maryland Ave Unit 306
- 222 Monterey Rd Unit 1205
- 522 N Jackson St Unit 305
- 522 N Jackson St Unit 304
- 522 N Jackson St Unit 303
- 522 N Jackson St Unit 302
- 522 N Jackson St Unit 301
- 522 N Jackson St Unit 205
- 522 N Jackson St Unit 203
- 522 N Jackson St Unit 202
- 522 N Jackson St Unit 206
- 522 N Jackson St Unit 201
- 522 N Jackson St Unit 105
- 522 N Jackson St Unit 104
- 522 N Jackson St Unit 103
- 522 N Jackson St Unit 102
- 522 N Jackson St Unit 106
- 522 N Jackson St Unit 101
- 510 N Jackson St
- 510 N Jackson St Unit Rm
- 510 N Jackson St Unit 308
- 510 N Jackson St Unit 305