R
Seller's Agent in 2025
Ron Ho
Howard Hanna
(330) 608-2700
1 in this area
17 Total Sales

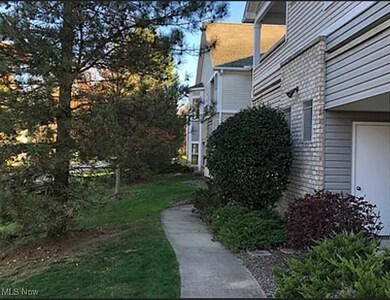
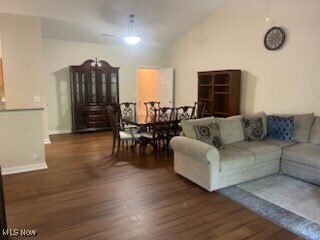
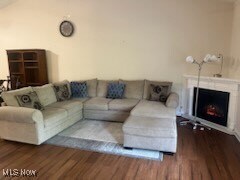

Welcome to this stunning townhouse featuring 3 spacious bedrooms, 2 full bathrooms, and a 1.5-car garage with an additional storage room. Enjoy the ease of single-floor living in a bright and open layout, highlighted by soaring ceilings and a cozy fireplace in the inviting living room.
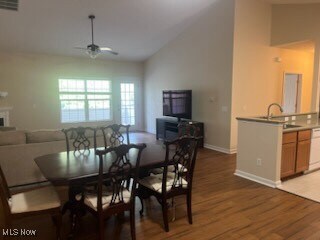
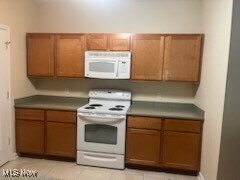
The kitchen boasts gleaming Corian countertops and ceramic tile flooring, ideal for both everyday use and entertaining. The living room and hallway are adorned with newer bamboo flooring, adding warmth and elegance throughout.
Included for your convenience are a washer, dryer, refrigerator, and stove. Step out onto your private balcony and enjoy a low-maintenance lifestyle—no yard work required!
The expansive master suite features a walk-in closet and a private en-suite bathroom, offering a peaceful retreat.
Utilities such as water, sewage, and trash are included.
Nestled in a quiet neighborhood, this home is just minutes from shopping centers, highways, and schools, offering the perfect balance of serenity and convenience.
| Date | Type | Sale Price | Title Company |
|---|---|---|---|
| Warranty Deed | $250,000 | Ace Title | |
| Warranty Deed | $214,000 | None Available | |
| Warranty Deed | $159,000 | First Security Title Corp | |
| Quit Claim Deed | -- | None Available |
| Date | Status | Loan Amount | Loan Type |
|---|---|---|---|
| Previous Owner | $180,000 | New Conventional | |
| Previous Owner | $127,200 | New Conventional |
| Date | Event | Price | List to Sale | Price per Sq Ft | Prior Sale |
|---|---|---|---|---|---|
| 10/09/2025 10/09/25 | Sold | $250,000 | -1.9% | $147 / Sq Ft | |
| 09/06/2025 09/06/25 | Pending | -- | -- | -- | |
| 09/05/2025 09/05/25 | Price Changed | $254,900 | -3.8% | $150 / Sq Ft | |
| 08/18/2025 08/18/25 | Price Changed | $264,900 | -1.5% | $156 / Sq Ft | |
| 08/04/2025 08/04/25 | For Sale | $269,000 | 0.0% | $159 / Sq Ft | |
| 11/20/2023 11/20/23 | Rented | $1,450 | +7.4% | -- | |
| 11/20/2023 11/20/23 | Under Contract | -- | -- | -- | |
| 10/24/2023 10/24/23 | For Rent | $1,350 | 0.0% | -- | |
| 04/13/2021 04/13/21 | Sold | $214,000 | +2.4% | $126 / Sq Ft | View Prior Sale |
| 03/03/2021 03/03/21 | Pending | -- | -- | -- | |
| 02/27/2021 02/27/21 | Price Changed | $209,000 | +11842.9% | $123 / Sq Ft | |
| 02/27/2021 02/27/21 | For Sale | $1,750 | 0.0% | $1 / Sq Ft | |
| 09/14/2020 09/14/20 | Rented | $730 | -58.3% | -- | |
| 08/27/2020 08/27/20 | Under Contract | -- | -- | -- | |
| 07/23/2020 07/23/20 | For Rent | $1,750 | 0.0% | -- | |
| 10/10/2019 10/10/19 | Rented | $1,750 | 0.0% | -- | |
| 10/06/2019 10/06/19 | Under Contract | -- | -- | -- | |
| 08/22/2019 08/22/19 | For Rent | $1,750 | 0.0% | -- | |
| 08/19/2019 08/19/19 | Sold | $159,000 | -3.6% | $94 / Sq Ft | View Prior Sale |
| 07/25/2019 07/25/19 | Pending | -- | -- | -- | |
| 07/17/2019 07/17/19 | For Sale | $164,900 | -- | $97 / Sq Ft |
| Year | Tax Paid | Tax Assessment Tax Assessment Total Assessment is a certain percentage of the fair market value that is determined by local assessors to be the total taxable value of land and additions on the property. | Land | Improvement |
|---|---|---|---|---|
| 2025 | $4,162 | $74,186 | $8,876 | $65,310 |
| 2024 | $4,162 | $74,186 | $8,876 | $65,310 |
| 2023 | $4,162 | $74,186 | $8,876 | $65,310 |
| 2022 | $3,950 | $57,547 | $6,825 | $50,722 |
| 2021 | $3,562 | $57,547 | $6,825 | $50,722 |
| 2020 | $3,580 | $57,550 | $6,830 | $50,720 |
| 2019 | $3,681 | $54,950 | $6,830 | $48,120 |
| 2018 | $3,510 | $54,950 | $6,830 | $48,120 |
| 2017 | $3,655 | $54,950 | $6,830 | $48,120 |
| 2016 | $3,650 | $54,950 | $6,830 | $48,120 |
| 2015 | $3,655 | $54,950 | $6,830 | $48,120 |
| 2014 | $3,634 | $54,950 | $6,830 | $48,120 |
| 2013 | $3,633 | $55,590 | $6,830 | $48,760 |
R
Seller's Agent in 2025
Ron Ho
Howard Hanna
(330) 608-2700
1 in this area
17 Total Sales

Seller's Agent in 2023
Jie (Jay) Yao
RE/MAX
(716) 206-4604
2 in this area
29 Total Sales
Seller's Agent in 2021
Erica Barbosa Grigera
Berkshire Hathaway HomeServices Stouffer Realty
(330) 819-7008
19 in this area
58 Total Sales
Buyer's Agent in 2020
Tom Boggs
Berkshire Hathaway HomeServices Stouffer Realty
(330) 322-7500
15 in this area
232 Total Sales
Seller's Agent in 2019
Sherri Costanzo
RE/MAX Crossroads
(330) 807-2722
68 in this area
379 Total Sales
Source: MLS Now (Howard Hanna)
MLS Number: 5145340
APN: 15-08135
Disclaimer: Certain information contained herein is derived from information provided by parties other than Homes.com. All information provided is deemed reliable, but is not guaranteed to be accurate and should be independently verified.
![]() Certain information contained herein is derived from information provided by parties other than Homes.com. All information provided is deemed reliable, but is not guaranteed to be accurate and should be independently verified.
Certain information contained herein is derived from information provided by parties other than Homes.com. All information provided is deemed reliable, but is not guaranteed to be accurate and should be independently verified.