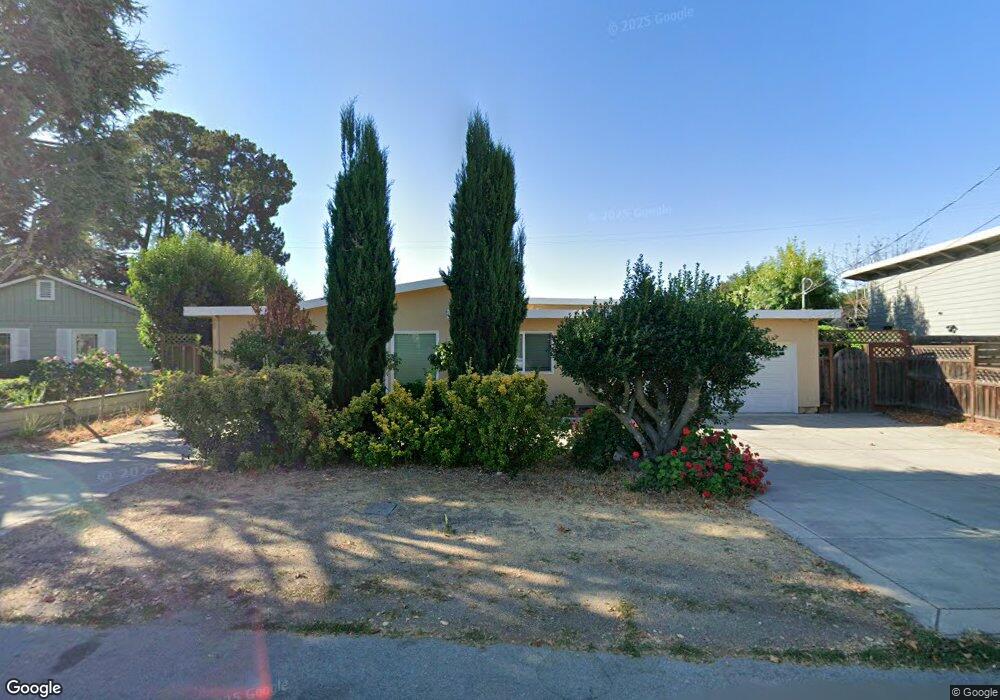
522 Sunnymount Ave Sunnyvale, CA 94087
Estimated Value: $2,477,000 - $3,005,975
3
Beds
3
Baths
1,309
Sq Ft
$2,098/Sq Ft
Est. Value
About This Home
This home is located at 522 Sunnymount Ave, Sunnyvale, CA 94087 and is currently estimated at $2,746,494, approximately $2,098 per square foot. 522 Sunnymount Ave is a home located in Santa Clara County with nearby schools including Cumberland Elementary School, Sunnyvale Middle School, and Fremont High School.
Ownership History
Date
Name
Owned For
Owner Type
Purchase Details
Closed on
Nov 1, 2010
Sold by
Amely Mahmoud
Bought by
Amely Mahmoud
Current Estimated Value
Home Financials for this Owner
Home Financials are based on the most recent Mortgage that was taken out on this home.
Original Mortgage
$417,000
Outstanding Balance
$260,496
Interest Rate
3.25%
Mortgage Type
New Conventional
Estimated Equity
$2,485,998
Purchase Details
Closed on
Jan 28, 2003
Sold by
Amely Niloufar Hoveyda
Bought by
Amely Mahmoud
Home Financials for this Owner
Home Financials are based on the most recent Mortgage that was taken out on this home.
Original Mortgage
$311,500
Interest Rate
5.12%
Mortgage Type
New Conventional
Purchase Details
Closed on
Feb 15, 1996
Sold by
Wolfe Elizabeth Eleanor
Bought by
Amely Mahmoud and Amely Niloufar Hoveyda
Home Financials for this Owner
Home Financials are based on the most recent Mortgage that was taken out on this home.
Original Mortgage
$220,000
Interest Rate
7.25%
Create a Home Valuation Report for This Property
The Home Valuation Report is an in-depth analysis detailing your home's value as well as a comparison with similar homes in the area
Home Values in the Area
Average Home Value in this Area
Purchase History
| Date | Buyer | Sale Price | Title Company |
|---|---|---|---|
| Amely Mahmoud | -- | First American Title | |
| Amely Mahmoud | -- | Fidelity National Title Ins | |
| Amely Mahmoud | $275,000 | North American Title Co |
Source: Public Records
Mortgage History
| Date | Status | Borrower | Loan Amount |
|---|---|---|---|
| Open | Amely Mahmoud | $417,000 | |
| Closed | Amely Mahmoud | $311,500 | |
| Closed | Amely Mahmoud | $220,000 | |
| Closed | Amely Mahmoud | $50,000 |
Source: Public Records
Tax History Compared to Growth
Tax History
| Year | Tax Paid | Tax Assessment Tax Assessment Total Assessment is a certain percentage of the fair market value that is determined by local assessors to be the total taxable value of land and additions on the property. | Land | Improvement |
|---|---|---|---|---|
| 2025 | $6,489 | $558,556 | $274,091 | $284,465 |
| 2024 | $6,489 | $547,605 | $268,717 | $278,888 |
| 2023 | $6,412 | $536,869 | $263,449 | $273,420 |
| 2022 | $6,294 | $526,343 | $258,284 | $268,059 |
| 2021 | $6,228 | $516,023 | $253,220 | $262,803 |
| 2020 | $6,148 | $510,733 | $250,624 | $260,109 |
| 2019 | $6,013 | $500,719 | $245,710 | $255,009 |
| 2018 | $5,894 | $490,902 | $240,893 | $250,009 |
| 2017 | $5,818 | $481,277 | $236,170 | $245,107 |
| 2016 | $5,575 | $471,841 | $231,540 | $240,301 |
| 2015 | $5,606 | $464,755 | $228,063 | $236,692 |
| 2014 | $5,496 | $455,652 | $223,596 | $232,056 |
Source: Public Records
Map
Nearby Homes
- 128 Brahms Way
- 654 Princeton Dr
- Plan 5 at Vida
- Plan 1 at Vida
- Plan 8 at Vida
- Plan 2 at Vida
- Plan 7 at Vida
- Plan 4 at Vida
- Plan 3 at Vida
- Plan 6 at Vida
- 1304 Barbet Cir Unit 1
- 1304 Barbet Cir Unit 6
- 1303 Besra Terrace Unit 7
- 1303 Besra Terrace Unit 5
- 1303 Besra Terrace Unit 13
- 1303 Besra Terrace Unit 2
- 1308 Yarmouth Terrace
- 541 Holthouse Terrace
- 1229 Picasso Dr
- 745 Reseda Dr
- 528 Sunnymount Ave
- 516 Sunnymount Ave
- 534 Sunnymount Ave
- 521 Sunnymount Ave
- 527 Sunnymount Ave
- 539 W Remington Dr
- 504 Sunnymount Ave
- 540 Sunnymount Ave
- 533 Sunnymount Ave
- 547 W Remington Dr
- 522 Dawn Dr
- 539 Sunnymount Ave
- 546 Sunnymount Ave
- 528 Dawn Dr
- 553 W Remington Dr
- 534 Dawn Dr
- 538 W Remington Dr
- 503 Dawn Dr
- 501 Dawn Dr
- 545 Sunnymount Ave