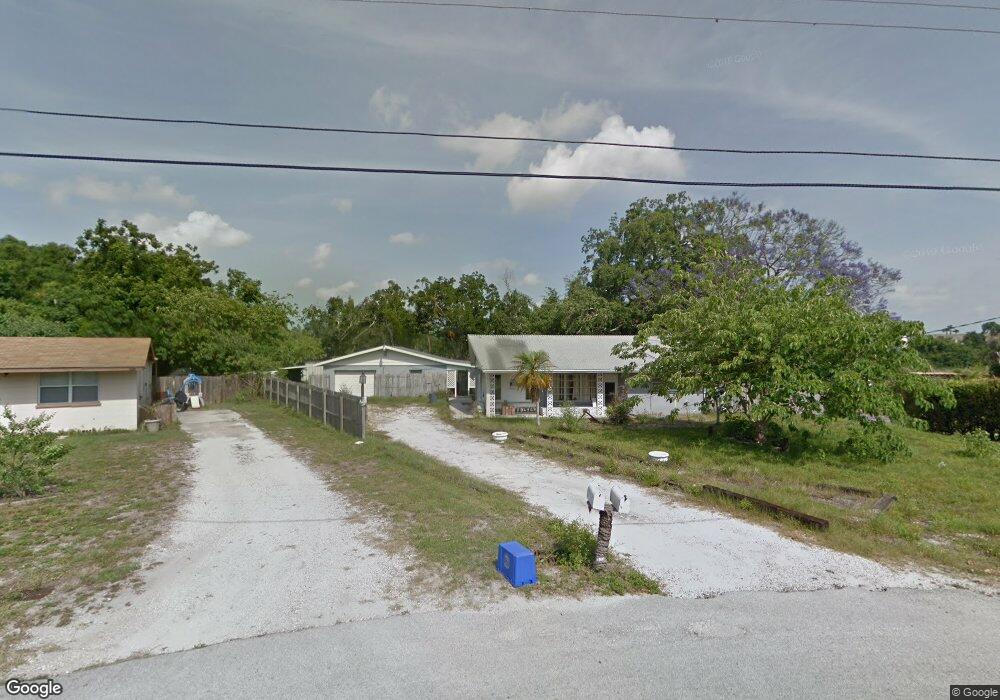
5220 47th St E Bradenton, FL 34203
East Bradenton NeighborhoodEstimated Value: $535,000 - $644,000
4
Beds
3
Baths
3,350
Sq Ft
$175/Sq Ft
Est. Value
About This Home
This home is located at 5220 47th St E, Bradenton, FL 34203 and is currently estimated at $585,747, approximately $174 per square foot. 5220 47th St E is a home located in Manatee County with nearby schools including William H. Bashaw Elementary School, Braden River Middle School, and Braden River High School.
Ownership History
Date
Name
Owned For
Owner Type
Purchase Details
Closed on
Mar 22, 2021
Sold by
Collier Samuel J and Collier Denise L
Bought by
Moore Jason Scott and Moore Linda Louise
Current Estimated Value
Home Financials for this Owner
Home Financials are based on the most recent Mortgage that was taken out on this home.
Original Mortgage
$300,000
Outstanding Balance
$269,065
Interest Rate
2.73%
Mortgage Type
New Conventional
Estimated Equity
$316,682
Purchase Details
Closed on
Nov 18, 1996
Sold by
Shannon Chris and Shannon Christopher J
Bought by
Collier Sameul J and Collier Denise L
Home Financials for this Owner
Home Financials are based on the most recent Mortgage that was taken out on this home.
Original Mortgage
$92,000
Interest Rate
7.83%
Purchase Details
Closed on
Apr 25, 1994
Sold by
Shannon Chris and Shannon Sandra K
Bought by
Shannon Chris and Shannon Christopher J
Create a Home Valuation Report for This Property
The Home Valuation Report is an in-depth analysis detailing your home's value as well as a comparison with similar homes in the area
Home Values in the Area
Average Home Value in this Area
Purchase History
| Date | Buyer | Sale Price | Title Company |
|---|---|---|---|
| Moore Jason Scott | $400,000 | Wr Title Services | |
| Collier Sameul J | $118,000 | -- | |
| Shannon Chris | -- | -- |
Source: Public Records
Mortgage History
| Date | Status | Borrower | Loan Amount |
|---|---|---|---|
| Open | Moore Jason Scott | $300,000 | |
| Previous Owner | Collier Sameul J | $92,000 |
Source: Public Records
Tax History
| Year | Tax Paid | Tax Assessment Tax Assessment Total Assessment is a certain percentage of the fair market value that is determined by local assessors to be the total taxable value of land and additions on the property. | Land | Improvement |
|---|---|---|---|---|
| 2025 | $4,785 | $344,462 | -- | -- |
| 2024 | $4,785 | $334,754 | -- | -- |
| 2023 | $7,917 | $512,539 | $45,900 | $466,639 |
| 2022 | $7,101 | $440,389 | $45,000 | $395,389 |
| 2021 | $2,786 | $196,526 | $0 | $0 |
| 2020 | $2,856 | $193,813 | $0 | $0 |
| 2019 | $2,794 | $189,456 | $0 | $0 |
| 2018 | $2,750 | $185,923 | $0 | $0 |
| 2017 | $2,557 | $182,099 | $0 | $0 |
| 2016 | $2,536 | $178,354 | $0 | $0 |
| 2015 | $2,539 | $177,114 | $0 | $0 |
| 2014 | $2,539 | $175,708 | $0 | $0 |
| 2013 | $2,501 | $173,111 | $0 | $0 |
Source: Public Records
Map
Nearby Homes
- 4622 Sabal Key Dr
- 4761 Sabal Key Dr
- 4617 Sabal Key Dr
- 4478 Pro Am Ave E
- 4838 Maymont Park Cir
- 5423 Fairfield Blvd
- 5419 Fairfield Blvd
- 5019 Misty Canal Place
- 4882 Maymont Park Cir
- 5312 Fairfield Blvd
- 4894 Maymont Park Cir
- 5518 Whistling Tree Ln
- 4584 Runabout Way
- 5072 Kilty Ct E
- 5125 Wedge Ct E
- 4312 Pro Am Ave E
- 4321 Presidential Avenue Cir E
- 5551 Wind Sail St Unit P003
- 5512 47th Ct E
- 5513 47th Ct E
- 5220 47th St E
- 5222 47th St E
- 5228 47th St E
- 5231 47th St E
- 5232 47th St E
- 5216 47th St E
- 5216 47th St E
- 5220 47th Street Ct E
- 5306 47th St E
- 5305 47th St E
- 5236 46th Street Ct E
- 5231 46th Street Ct E
- 5308 47th St E
- 5304 47th Street Ct E
- 5304 47th Street Ct E
- 5219 47th Street Ct E
- 5215 47th St E
- 5211 47th St E
- 5219 47th St E
- 5311 46th Street Ct E
Your Personal Tour Guide
Ask me questions while you tour the home.