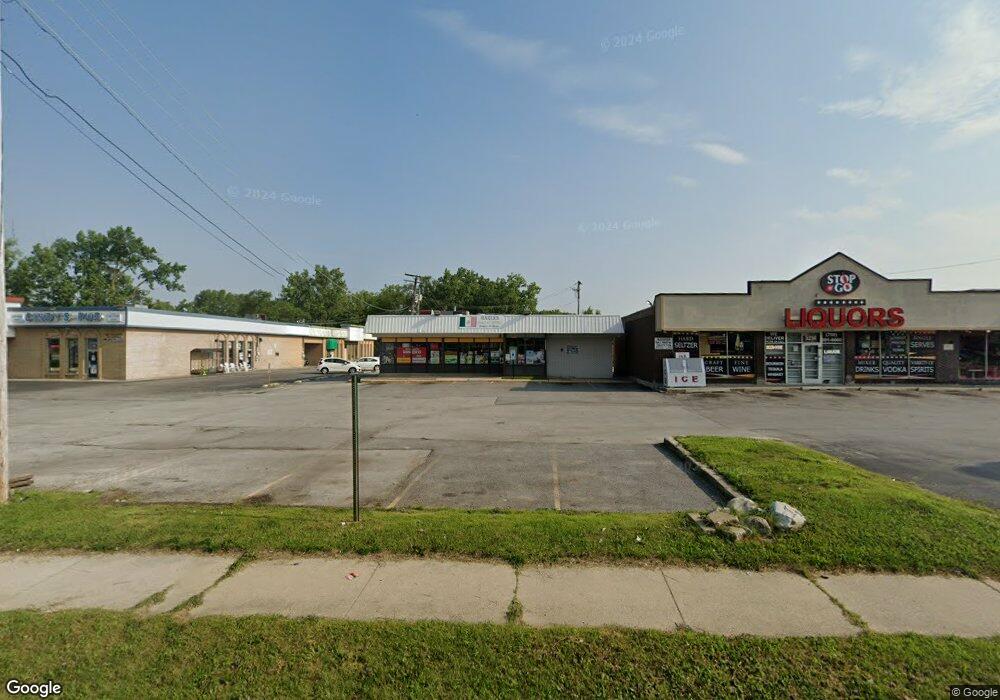
5220 W 159th St Oak Forest, IL 60452
Estimated Value: $136,505
--
Bed
--
Bath
--
Sq Ft
0.31
Acres
About This Home
This home is located at 5220 W 159th St, Oak Forest, IL 60452 and is currently estimated at $136,505. 5220 W 159th St is a home located in Cook County with nearby schools including Kimberly Heights Elementary School, Scarlet Oak Elementary School, and Arbor Park Middle School.
Ownership History
Date
Name
Owned For
Owner Type
Purchase Details
Closed on
Oct 14, 2011
Sold by
Series G Of Ibt Holdings Llc
Bought by
Yamini Llc
Current Estimated Value
Purchase Details
Closed on
Nov 24, 2010
Sold by
Marinis Bobby
Bought by
Series G Of Ibt Holdings Llc
Purchase Details
Closed on
Nov 14, 2003
Sold by
Lasalle Bank Na
Bought by
Standard Bank & Trust Co and Trust #17142
Home Financials for this Owner
Home Financials are based on the most recent Mortgage that was taken out on this home.
Original Mortgage
$135,000
Interest Rate
5.95%
Mortgage Type
Commercial
Purchase Details
Closed on
Nov 6, 1996
Sold by
South Holland Trust & Svgs Bank
Bought by
American National Bank and Trust #122211-07
Home Financials for this Owner
Home Financials are based on the most recent Mortgage that was taken out on this home.
Original Mortgage
$90,000
Interest Rate
7.94%
Mortgage Type
Commercial
Create a Home Valuation Report for This Property
The Home Valuation Report is an in-depth analysis detailing your home's value as well as a comparison with similar homes in the area
Home Values in the Area
Average Home Value in this Area
Purchase History
| Date | Buyer | Sale Price | Title Company |
|---|---|---|---|
| Yamini Llc | $65,000 | Cti | |
| Series G Of Ibt Holdings Llc | -- | None Available | |
| Standard Bank & Trust Co | $180,000 | Rtc | |
| American National Bank | $145,000 | -- |
Source: Public Records
Mortgage History
| Date | Status | Borrower | Loan Amount |
|---|---|---|---|
| Previous Owner | Standard Bank & Trust Co | $135,000 | |
| Previous Owner | American National Bank | $90,000 |
Source: Public Records
Tax History Compared to Growth
Tax History
| Year | Tax Paid | Tax Assessment Tax Assessment Total Assessment is a certain percentage of the fair market value that is determined by local assessors to be the total taxable value of land and additions on the property. | Land | Improvement |
|---|---|---|---|---|
| 2024 | $17,885 | $49,453 | $25,200 | $24,253 |
| 2023 | $21,948 | $49,453 | $25,200 | $24,253 |
| 2022 | $21,948 | $47,117 | $23,520 | $23,597 |
| 2021 | $21,407 | $47,116 | $23,520 | $23,596 |
| 2020 | $20,638 | $47,116 | $23,520 | $23,596 |
| 2019 | $26,205 | $58,401 | $21,840 | $36,561 |
| 2018 | $25,629 | $58,401 | $21,840 | $36,561 |
| 2017 | $27,939 | $63,960 | $21,840 | $42,120 |
| 2016 | $28,134 | $61,999 | $18,480 | $43,519 |
| 2015 | $27,331 | $61,999 | $18,480 | $43,519 |
| 2014 | $26,654 | $61,999 | $18,480 | $43,519 |
| 2013 | $13,654 | $35,649 | $18,480 | $17,169 |
Source: Public Records
Map
Nearby Homes
- 15804 Laramie Ave Unit 4
- 5310 159th St
- 17301 Lockwood Ave
- 5137 160th St
- 15601 Latrobe Ave
- 5140 Shadow Creek Dr Unit 1
- 5150 Shadow Creek Dr Unit 4
- 16000 Long Ave
- 5028 156th St
- 16352 169 Lot #15 Place
- 16352 169 Lot #13 Place
- 16352 169 Lot #14 Place
- 16352 Place
- 16352 169 Lot #9 Place
- 16352 169 Lot #8 Place
- 16352 169 Lot #7 Place
- 16352 169 Lot #6 Place
- 16352 169 Lot #3 Place
- 14901 S Cicero Ave
- 16101 Debra Dr
- 5220 159th St
- 15860 Laramie Ave Unit 3N
- 15860 Laramie Ave Unit 2N
- 15860 Laramie Ave Unit 2S
- 15860 Laramie Ave Unit 1S
- 15860 Laramie Ave Unit 3S
- 15860 Laramie Ave Unit 1N
- 15850 Laramie Ave Unit 302
- 15850 Laramie Ave Unit 101
- 15850 Laramie Ave Unit 102
- 15850 Laramie Ave Unit 201
- 15850 Laramie Ave Unit 202
- 5233 159th St
- 5233 159th St
- 15806 Laramie Ave Unit 3
- 15806 Laramie Ave Unit 12
- 15806 Laramie Ave Unit 10
- 15806 Laramie Ave Unit G3
- 15806 Laramie Ave Unit 9
- 15806 Laramie Ave Unit G6