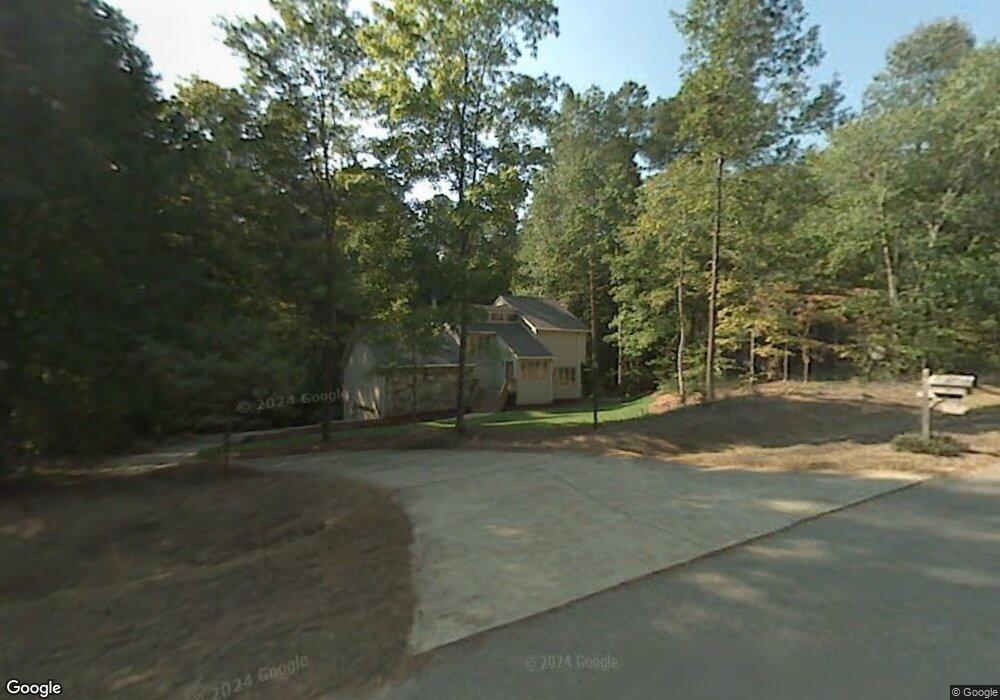
5221 Caber Rd Raleigh, NC 27613
Wood Valley NeighborhoodEstimated Value: $762,000 - $835,000
3
Beds
4
Baths
3,312
Sq Ft
$243/Sq Ft
Est. Value
About This Home
This home is located at 5221 Caber Rd, Raleigh, NC 27613 and is currently estimated at $805,074, approximately $243 per square foot. 5221 Caber Rd is a home located in Wake County with nearby schools including Leesville Road Middle School, Leesville Road High School, and The Franciscan School.
Ownership History
Date
Name
Owned For
Owner Type
Purchase Details
Closed on
May 10, 2018
Sold by
Robert E Ward
Bought by
Dyson James and Hammond Sarah
Current Estimated Value
Home Financials for this Owner
Home Financials are based on the most recent Mortgage that was taken out on this home.
Original Mortgage
$364,000
Outstanding Balance
$314,492
Interest Rate
4.55%
Estimated Equity
$490,582
Purchase Details
Closed on
Nov 7, 2008
Sold by
Borghese Andrew J and Borghese Cynthia R
Bought by
Ward Robert E and Smith Marcilynn
Home Financials for this Owner
Home Financials are based on the most recent Mortgage that was taken out on this home.
Original Mortgage
$368,000
Interest Rate
6.11%
Mortgage Type
Purchase Money Mortgage
Purchase Details
Closed on
Dec 16, 2005
Sold by
Todd Robert S and Todd Angela S
Bought by
Borghese Andrew J and Borghese Cynthia R
Home Financials for this Owner
Home Financials are based on the most recent Mortgage that was taken out on this home.
Original Mortgage
$268,000
Interest Rate
6.23%
Mortgage Type
Fannie Mae Freddie Mac
Create a Home Valuation Report for This Property
The Home Valuation Report is an in-depth analysis detailing your home's value as well as a comparison with similar homes in the area
Home Values in the Area
Average Home Value in this Area
Purchase History
| Date | Buyer | Sale Price | Title Company |
|---|---|---|---|
| Dyson James | -- | -- | |
| Ward Robert E | $409,000 | Chicago Title Insurance Co | |
| Borghese Andrew J | $335,000 | None Available |
Source: Public Records
Mortgage History
| Date | Status | Borrower | Loan Amount |
|---|---|---|---|
| Open | Dyson James | $364,000 | |
| Closed | Dyson James | -- | |
| Previous Owner | Ward Robert E | $368,000 | |
| Previous Owner | Borghese Andrew J | $268,000 |
Source: Public Records
Tax History Compared to Growth
Tax History
| Year | Tax Paid | Tax Assessment Tax Assessment Total Assessment is a certain percentage of the fair market value that is determined by local assessors to be the total taxable value of land and additions on the property. | Land | Improvement |
|---|---|---|---|---|
| 2025 | $4,453 | $693,140 | $210,000 | $483,140 |
| 2024 | $4,324 | $693,140 | $210,000 | $483,140 |
| 2023 | $3,531 | $450,307 | $135,000 | $315,307 |
| 2022 | $3,272 | $450,307 | $135,000 | $315,307 |
| 2021 | $3,184 | $450,307 | $135,000 | $315,307 |
| 2020 | $3,132 | $450,307 | $135,000 | $315,307 |
| 2019 | $3,331 | $405,362 | $135,000 | $270,362 |
| 2018 | $3,062 | $405,362 | $135,000 | $270,362 |
| 2017 | $2,902 | $405,362 | $135,000 | $270,362 |
| 2016 | $2,843 | $405,362 | $135,000 | $270,362 |
| 2015 | $2,824 | $403,681 | $122,000 | $281,681 |
| 2014 | $2,676 | $403,681 | $122,000 | $281,681 |
Source: Public Records
Map
Nearby Homes
- 8717 Little Deer Ln
- 11804 Mountbatten Way
- 5528 Hawthorne Park
- 5009 Wood Valley Dr
- 11913 Eagle Bluff Cir
- 11953 Eagle Cliff Ct
- 10729 Winding Wood Trail
- 4817 Wood Valley Dr
- 12304 Whartons Way
- 5020 Red Cedar Rd
- 5965 Dunbarton Way
- 2612 Scarlet Sage Ct
- 5240 Indigo Moon Way
- 2409 Loring Ct
- 2729 Sunnystone Way
- 11209 Sedgefield Dr
- 5308 Grand Gate Dr
- 10305 Old Creedmoor Rd
- Harlow Plan at Bayberry
- 12808 Edsel Dr
- 5225 Caber Rd
- 5217 Caber Rd
- 5208 Wood Valley Dr
- 5213 Caber Rd
- 5212 Caber Rd
- 5216 Wood Valley Dr
- 5229 Caber Rd
- 5204 Wood Valley Dr
- 5216 Caber Rd
- 5300 Wood Valley Dr
- 5209 Caber Rd
- 5220 Caber Rd
- 10600 Brownsburg Place
- 5200 Wood Valley Dr
- 5224 Caber Rd
- 5308 Wood Valley Dr
- 10605 Brownsburg Place
- 5221 Wood Valley Dr Unit 15
- 5213 Wood Valley Dr Unit 17
- 5213 Wood Valley Dr